Download
1 / 10
100 likes | 212 Views
Sexually Transmitted Disease Surveillance 2010 Division of STD Prevention. STDs in Women and Infants. Chlamydia—Women—Rates by State, United States and Outlying Areas, 2010.

E N D
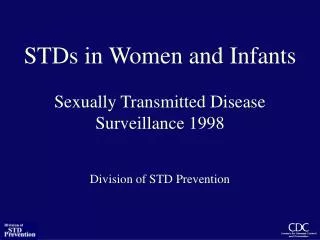
Sexually Transmitted Disease Surveillance 2010 Division of STD Prevention STDs in Women and Infants
Chlamydia—Women—Rates by State, United States and Outlying Areas, 2010 NOTE: The total chlamydial infection rate among women in the United States and outlying areas (Guam, Puerto Rico, and Virgin Islands) was 605.8 per 100,000 female population.
Chlamydia—Positivity Among Women Aged 15–24 Years Tested in Prenatal Clinics, by State, Infertility Prevention Project, United States and Outlying Areas, 2010 * States/areas not meeting minimum inclusion criteria in prenatal clinics. NOTE: Includes states and outlying areas that reported chlamydia positivity data on at least 100 women aged 15–24 years during 2010.
Gonorrhea—Women—Rates by State, United States and Outlying Areas, 2010 NOTE: The total gonorrhea infection rate among women in the United States and outlying areas (Guam, Puerto Rico, and Virgin Islands) was 105.2 per 100,000 female population.
Gonorrhea—Positivity Among Women Aged 15–24 Years Tested in Prenatal Clinics, by State, Infertility Prevention Project, United States and Outlying Areas, 2010 * States/areas not meeting minimum inclusion criteria in prenatal clinics. NOTE: Includes states and outlying areas that reported gonorrhea positivity data on at least 100 women aged 15–24 years during 2010.
Primary and Secondary Syphilis—Women—Rates by State, United States and Outlying Areas, 2010 NOTE: The total rate of primary and secondary syphilis among women in the United States and outlying areas (Guam, Puerto Rico, and Virgin Islands) was 1.1 per 100,000 females.
Congenital Syphilis—Infants—Rates by Year of Birth and State, United States and Outlying Areas, 2010 NOTE: The total rate of congenital syphilis for infants by year of birth for the United States and outlying areas (Guam, Puerto Rico, and Virgin Islands) was 8.7 per 100,000 live births.
Pelvic Inflammatory Disease—Hospitalizations of Women Aged 15–44 Years, United States, 2000–2009 Hospitalizations (in thousands) 75 60 45 Acute, Unspecified Chronic 30 15 0 2000 2001 2002 2003 2004 2005 2006 2007 2008 2009 Year NOTE: The relative standard errors for acute and unspecified pelvic inflammatory disease (PID) cases ranges from 8%–18%. The relative standard error for chronic PID cases ranges from 12%–28%. Data only available through 2009. SOURCE: 2009 National Hospital Discharge Survey [Internet]. Atlanta: Centers for Disease Control and Prevention. Available from: http://www.cdc.gov/nchs/nhds/about/nhds.htm.
Pelvic Inflammatory Disease—Initial Visits to Physicians’ Offices by Women Aged 15–44 Years, United States, 2001–2010 Visits (in thousands) 250 200 150 100 50 0 2001 2002 2003 2004 2005 2006 2007 2008 2009 2010 Year NOTE: The relative standard errors for these estimates are 21.6%–30%. SOURCE: IMS Health, Integrated Promotional Services™. IMS Health Report, 1966–2010.
Ectopic Pregnancy—Hospitalizations of Women Aged 15–44 Years, United States, 2000–2009 Hospitalizations (in thousands) 50 40 30 20 10 0 2000 2001 2002 2003 2004 2005 2006 2007 2008 2009 Year NOTE: The relative standard errors for these estimates are 10%–23%. Data only available through 2009. SOURCE: 2009 National Hospital Discharge Survey [Internet]. Atlanta: Centers for Disease Control and Prevention. Available from: http://www.cdc.gov/nchs/nhds/about/nhds.htm.