Download

1 / 20
200 likes | 207 Views
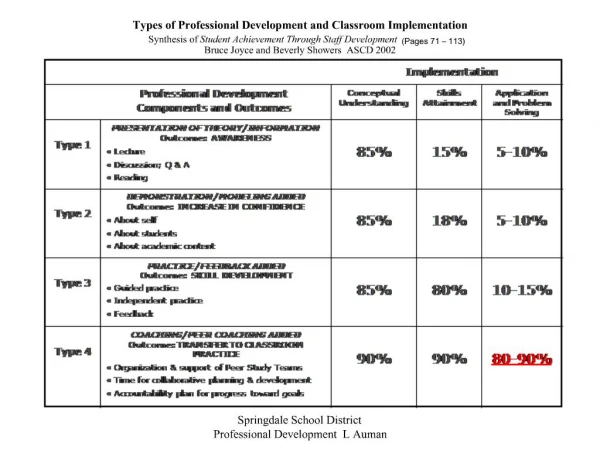
Remodece meeting January 2007 . Nicolai Feilberg. WP5 Analysis. List of Input data needed for the analysis based on survey/monitoring campaign. Example (Norway) Deliverable D10:

E N D
Remodece meeting January 2007 Nicolai Feilberg
WP5 Analysis • List of Input data needed for the analysis based on survey/monitoring campaign. • Example (Norway) • Deliverable D10: • Yearly electricity consumption and average specific load curves for each type of appliance, and potential energy savings. • Deadline month 32 – summer 2008 • Demonstration of the Useload tool
List of the Input data needed from metered customers • “Household details” from Questionnaire • Location and contact details • Name • Address /Postal code/phone number • Group/stratum data: • How many persons live in the household in age groups: • Age 12 and less • Age 13 to 18 • Age 19 to 65 • Age more than 65 • Education level • Max no of years education of a person in household • Electricity consumption last year • In euros • In kWh • Building type: • Detached houses, row house, apartments • Electric space heating Yes/no • Electric water heating Yes/no
Input data needed from questionnaires 1 • Data needed from questionnaire • Average number of appliances used by customer groups • No of el. Cookers, fridges, etc • No of Lamps of given efficiency in certain room type • (room type -> type of use) • Define Stratum (group) the object belongs to • Defined by “Household details” in questionnaire • Person type • Main resident is young, single person • Families • Elderly people • Building type of the object: • Detached houses, row houses, apartments
Country specific data • We have data from the survey population. • The survey population have different characteristics compared to the population of the whole country • Use data from Statistic bureaus to alter the analysis results to fit with country specific data: • Calibration techniques available in Useload • Example: Share of students is 30% in sample and 20% in total population. Therefore the weight of the “student” data should be 20/30.
Before starting monitoring • Find suitable customer strata: Find groups that have similar behavior regarding presence and patterns of use. Strata must be part of overall national statistics. Example of groups: • Main resident is single person • Families • Elderly people • Divide also into types of buildings: • Detached houses, row houses, apartments
Example from Norway • Questionnaire (Statistics Norway, SSB) • Household expenditure survey (energy small part) • Customers answers questionnaire on • How many appliances they own • Sociological data (family size, income etc.) • (Size, building type, year of construction etc.) • Data is used to find • Expected ownership level (multiple) per customer stratum per appliance (next page) • Use data from earlier monitoring campaign (this example) • Monitored 5-10 appliances at residential customers • Load profiles and annual energy demand from Useload tool
Multiplier from questionnaire (SSB)Annual energy from monitoring campaign
Total for Norway 2001: Different building types have different annual energy demand etc.:
What data is stored in a profile? • Expected consumption as kWh per hour (kW) during a typical workday, and also per typical weekend/vacation day (next 2 page) • For some end-uses we can differ between seasons if necessary, but more metered data is then needed • Distribution of recorded data (next page) • Used to find confidence intervals from the data material • Confidence intervals shrinks for bigger samples • Temperature sensitivities kWh per hour/Centigrade (later) • To find how some end-uses changes consumption when temperature changes (Space heating and air condition)
Load profile for water heater 1000 customers, coincident load 14 customers
Result from Useload simulationDistribution of annual energy demand on different end-uses
Result from Useload simulationDistribution of annual energy demand on different end-uses Result agrees with earlier studies of end-use distribution. The method works!
Result from Useload simulationDistribution of peak power of different end-uses Residual = heating and cooling
Deliverable D10 • “Yearly electricity consumption and average specific load curves for each type of appliance, and potential energy savings.” • Deadline month 32 • Guideline • A guideline will be made so that each participant can make the countribution to the Deliverable. • Guide based on Useload • Useload will be made available for interested partners.
Contents of D10 • For each participant/country • For each group of appliances: • Electric Space heating/cooling • Report / Energy savings potential • Electric Water heating • Report / Energy savings potential • Lighting • Report / Energy savings potential • Other use of electricity • Report the following results for each appliance in group: • Yearly electricity consumption /standby consumption • Average specific load curves for each type of appliance • Potential energy savings • Potential energy savings
Discussion I • Hourly resolutions of load profiles is sufficient for aggregated studies • Load profiles could be stored as 10 minutes intervals • Metering period • 14 days periods/alternating customers – less metering equipment is needed. • Divide year into seasons: Winter, Spring, Summer, Fall • Differ between into workdays and weekends. • A relative low number of customers is available per strata • Only 100 customers will be metered. • Be sure to cover all main strata of country
Discussion II • Load that can be reduced by campaigns are of main interest: • Water heating • Move load by peak shaving • Space heating • Switch off/reduce during non presence • Lighting • Use efficient lighting • Standby consumption • Identified as (5%) part of some end-uses • Phone chargers etc can be switched off when not in use