Download
1 / 23
230 likes | 236 Views
Remodece meeting March 2008 . Nicolai Feilberg WP5: Methodology for Calculation of potential savings. WP5 Analysis. Metering campaign Calculation of Present state Norway. Status metering campaigns. Data received from Bulgaria 100 households Romania 8 households France 103 households

E N D
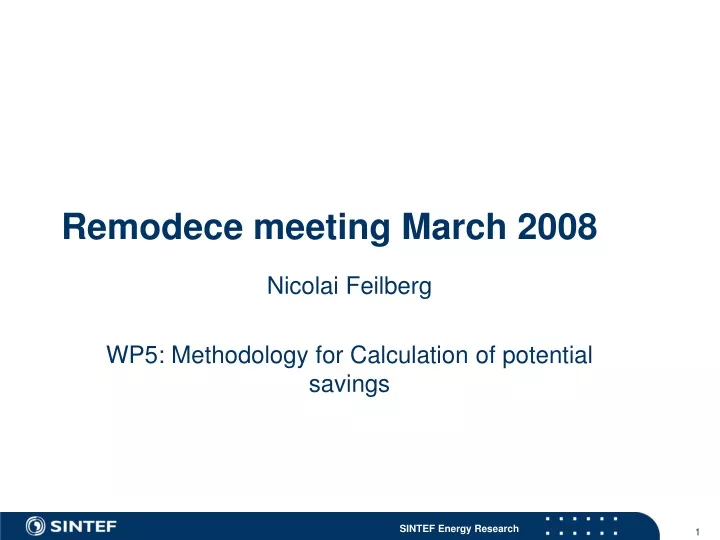
Remodece meeting March 2008 Nicolai Feilberg WP5: Methodology for Calculation of potential savings
WP5 Analysis • Metering campaign • Calculation of Present state Norway
Status metering campaigns • Data received from • Bulgaria 100 households • Romania 8 households • France 103 households • Italy 1 households • Denmark 1 households • Portugal 92? households • Czech 100 + households • Germany 100 households (file structure problem) • Norway 100 households, 90 finished analysed, 10 still registering
Metering campaign in Norway • Equipment used • 125 standard Power detectives • 5 electric cooker meters • 16 house centrals • Also to be used is 30 accumulating energy meters • Problems: • Late arrival of equipment • Radio transmission problems • Exterior antenna might solve problems • Reset after power shortage
Launcher • Power Detective launcher • Programming PowerDetectives to be placed in a house • Use of codes to uniquely indentifying kind of appliance, enables cross country comparisons • Storing of personal data file along with the Power detective files so that all information is available for analysis: • Age of persons • Number of persons in age groups • Climate • House types • Data are stored on SD card, used in the metering central
Result Norway case 2001 Based on metered data from 2007 and 2008.
Comparison Remodece and other results For households that owns an appliance type, KWh/year
Adjusting to total population Single and pairs without children 60 % in Norway – 41% for Washing machines Norway Two parents with one or more children 28% in Norway – 49% for Washing machines Norway Retired and other households 12 % in Norway – 9% for Washing machines Norway In Remodece, the values are adjusted to the total population demographics
Excel estimations for each appliance-type Excel sheet made by use of our tool “Useload”
Washing, drying, dishes A two year old Miele “A” washing machine, uses 1 kWh on a 60 degrees wash under standardized test program “EN 60456”
Lighting Based on load factor ca 1900 kWh/year More data is needed!
Ownership of each appliance type Data from SSB “Formålsfordeling av husholdningenes elektrisitetsforbruk i 2001 Are used for white goods, refrigerators, freezers, water heaters etc. Medienorge SSB Facts of Norwegian mass medias Are used for TVs, Mobil telephone chargers, PC, Laptop, Internet, DVD players, cable TV etc. Estimates showing annual energy consumption based on data from metering campaign, are multiplied with the typical number of appliances per household.
Statistics for each appliance type Estimate of expected value kWh/year Max value (max consumption kWh/year) Min value Standard deviation kWh/år Confidence interval Shows +/- interval for 95% probability of expected value Similar values are estimated adjusted for total demographic data 1-2 person in household (60%) 2 or more persons (28%) Retired people and others (12%)
Estimation of expected value • N =Total number of observations • ni =Number of observations of the strata that observation i belongs to • pi =Proportion in total parent group of the strata that observation i belongs to • di =Data for observation i
Estimation of standard deviation • Where • M =Total number of different strata • ni =Number of observations of the strata that observation i belongs to • pi =Proportion in total parent group of the strata that observation i belongs to