Download
1 / 42
460 likes | 787 Views
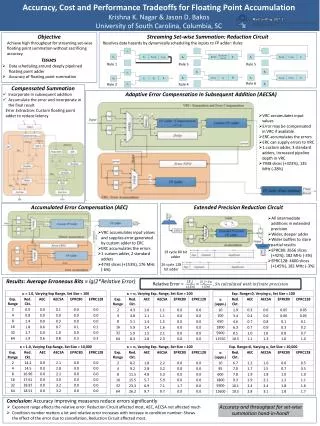
Time-Cost Tradeoffs. Time-Cost Tradeoff Example. Time-Cost Tradeoff Example (cont’d). Project. Duration. Total Direct. (weeks). Critical Path(s). Task(s) Reduced. Cost. 22. Start-A-C-End. -. $320. 21. Start-A-C-End. A. $328. Start-A-B-End. 20. Start-A-C-End. C. $338.

E N D
Time-Cost Tradeoff Example (cont’d) Project Duration Total Direct (weeks) Critical Path(s) Task(s) Reduced Cost 22 Start-A-C-End - $320 21 Start-A-C-End A $328 Start-A-B-End 20 Start-A-C-End C $338 Start-A-B-End 19 Start-A-C-End C $348 Start-A-B-End 18 Start-A-C-End A, B $361 Start-A-B-End
Linear Time-Cost Tradeoff In theory, the normal or expected duration of a task can be reduced by assigning additional resources to the task Cost Crash Point Crash cost = Slope (bj) = Increase in cost by reducing task by one time unit Normal Point Normal cost = Time Crash time = Normal time =
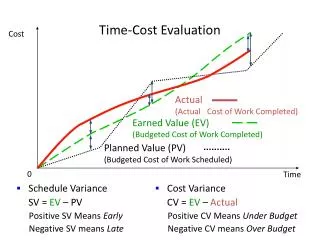
Cost Total Cost Indirect (overhead) Costs Direct Costs Project Duration Crash Time Minimum Cost Solution Normal Time Balancing Overhead & Direct Costs
Time-Cost Tradeoff (Direct Costs Only) Given Normal point with cost and time and Crash point with cost and time Assume constant marginal cost of crashing task j = Decision Variables: Sj = Starting time of task j END = End time of project tj = Duration of task j Minimize Total Direct Cost = Sj ≥ Si + ti for all tasks i Pj for all tasks in project END = Tmax tj, Sj ≥ 0
General Time-Cost Tradeoffs Minimize Total Costs = + I (END) + P L where I = indirect (overhead) cost/time period P = penalty cost/time period if END is delayed beyond deadline Tmax L = number of time periods project is delayed beyond deadline Tmax QUESTION: HOW TO DEFINE L?
“Observe that for the programmer, as for the chef, the urgency of the patron may govern the scheduled completion of the task, but it cannot govern the actual completion. An omelet, promised in ten minutes, may appear to be progressing nicely. But when it has not set in ten minutes, the customer has two choices--wait or eat it raw. Software customers have the same choices. The cook has another choice; he can turn up the heat. The result is often an omelet nothing can save--burned in one part, raw in another.” F.P. Brooks, “The Mythical Man-Month”, Datamation, Vol 20, No 12 (Dec, 1974), pp. 44-52. Software Project Schedules
Assume you want to develop program that will require (approximately) 50,000 lines of PERL code A typical programmer can write approximately 1500 lines of code per week Coordination time is M (M-1)/2 weeks Coordination Costs (Software Development Project)
“Adding manpower to a late software project makes it later.” F.P. Brooks, “The Mythical Man-Month”, Datamation, Vol 20, No 12 (Dec, 1974), pp. 44-52. Brook’s Law
Stage 0 Stage 1 Stage N Compressing New Product Development Projects Traditional Method Design follows a sequential pattern where information about the new product is slowly accumulated in consecutive stages
Stage 0 Stage 1 Stage N New Product Development Process Overlapped Product Design Allows downstream design stages to start before preceding upstream stages have finalized their specifications….
Issues and Tradeoffs What are the tradeoffs when moving from a traditional sequential product design process to an overlapped product design process? • Increased uncertainty (that leads to additional work) • Can add additional resources to tasks to reduce duration--but costs are increased
where there exists s paths to task k Classic PERT Model Defined • Since task durations are now random variables, time of any milestone (e.g., end of project) is now RV • Assume all tasks are statistically independent • Use values of mj to identify expected critical path • Since time of event (e.g., ESk) is now sum of independent RV’s, central limit theorem specifies that ESk is approximately normally distributed with mean E[ESk] and variance Var[ESk]
Classic PERT Model (cont’d) Thus, expected project duration is defined as: Using central limit theorem and standard normal distribution:
Task A Task C m = 4 A m = 10 C 2 s = 2 2 A s = 5 C Task B Task D m = 12 m = 3 B D 2 2 s = 4 s = 1 B D PERT Example #2 END START
Example #3 (cont’d) Criticality Indices Expected Project Duration = 23.22
Calculating Confidence Intervals For a confidence interval, we can use the sample mean and the estimated standard error of the mean where s is the sample standard deviation and n is the number of trials Using a normal approximation, a (1- a) two-sided confidence interval is given by
Critical Chain and the Theory of Constraints (TOC) Project “Goal” (according to Goldratt): Meet Project Due Date •Use deterministic CPM model with buffers to deal with any uncertainties, • Place project buffer after last task to protect the customer’s completion schedule, • Exploit constraining resources (make certain that resources are fully utilized), • Avoid wasting time slack time by encouraging early task completions, • Carefully monitor the status of the buffer(s) and communicate this status to other project team members on a regular basis, and • Make certain that the project team is 100 percent focused on critical chain tasks
End Task D User training Project Buffer Defined •Project Buffer is placed at the end of the project to protect the customer’s promised due date Task B Programming Task E Implementation Task F Task C Testing Task A Start Hardware requirements acquisition analysis Project Buffer User PERT Example #1 Revisited with Project Buffer
Calculating Project Buffer Size For those “who want a scientific approach to sizing buffers....” For tasks k on critical chain, we can calculate project buffer using following formula that project will be completed within worst-case duration estimates around 90 percent of the time:
END START Implications of Project Uncertainty Task A Task B Assume that the duration of both tasks A and B are described by a normal distribution with a mean of 30 days What is the probability that the project will be completed within 30 days?
Start Task 2 End Task 1 Uncertainty and Worker Behavior Consider a project with two tasks that must be completed serially The duration of each task is described by a RV with values Ti (i = 1, 2)
Parkinson’s Law (Expanding Work) “Work expands so as to fill the time available for its completion” Professor C.N. Parkinson (1957) Set a deadline D = 24 days So T(D) = project makespan (function of D) where E[T(D)] = E(T1) + E(T2) + E[max(0, D - T1 - T2)] E[T(D)] = 25 days
Procrastinating Worker Set a deadline D = 24 days E’[T(D)] = E(T1) + E(T2) + E{max[0, D - T1 - E(T2)]} Can show that E[T(D)] ≥ E’[T(D)] ≥ D What are the implications for project managers?
Schoenberger’s Hypothesis An increase in the variability of task durations will increase the expected project duration….
Schoenberger’s Hypothesis Illustrated Expected duration equals 14.55 days Increasing the variance of Task A: Results in an increased expected duration = 14.65 days
Risk Management • All projects involve some degree of risk • Need to identify all possible risks and outcomes • Need to identify person(s) responsible for managing project risks • Identify actions to reduce likelihood that adverse events will occur
Risk Analysis Risk Exposure (RE) or Risk Impact = (Probability of unexpected loss) x (size of loss) Example: Additional features required by client Loss: 3 weeks Probability: 20 percent Risk Exposure = (.20) (3 weeks) = .6 week
How to Manage Project Risks? Preventive Actions • Actions taken in anticipation of adverse events • May require action before project actually begins • Examples? Contingency Planning • What will you do if an adverse event does occur? • “Trigger point” invokes contingency plan • Frequently requires additional costs