Download
1 / 16
160 likes | 242 Views
Measuring Exhaustion Response: Example using Vagal Variance. Sean Collins. Evidence of Reduced Vagal Cardiac Control Variability in Exhausted Subjects & High Strain Job Subjects. Purpose :

E N D
Measuring Exhaustion Response: Example using Vagal Variance Sean Collins
Evidence of Reduced Vagal Cardiac Control Variability in Exhausted Subjects & High Strain Job Subjects • Purpose: • Present methods and propose hypotheses to test a component of the Stress Disequilibrium Theory based on “Regulatory System Variance” • HRV Project Background • Regulatory System Variance • HRV Project Methods • Determination of Exhausted Subjects • Repeated measures ANOVA
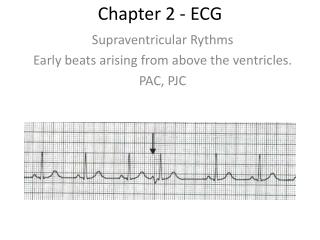
Regulatory System Variance: Strain & Exhaustion Hypothesis • High Frequency Variance components of HRV reflect Vagal system activity • Vagal system is a regulator of the cardiac system • Vagal system variance reflects Vagal system capacity to adapt to regulatory demands: Regulatory System Variance – i.e. Ashby’s Requisite Variety • Reduced Control (High Strain) & Exhaustion may lead to a reduction in Vagal system regulatory capacity – and therefore reduced Regulatory System Variance
Determination of Exhausted Subjects • Job Content Questionnaire Exhaustion Items • Unusually tired in the morning • End of the day, completely exhausted mentally and physically • “Most of the time” response required for both items • Four subjects reached pre-determined criteria for “exhaustion” • 3 “exhausted subjects – high strain jobs • Hybrid methodology
Regulatory System Variance – Controlled / Controlled Relationship System Regulation HFP Time Series (Vagal Control) 4 Hours (= 48 Epochs) Beat-to-Beat Variability RR Interval Series 5 – Minutes Frequency Analysis – HFP (.15-.4 Hz) 1 Epoch
Line of Identity Poincaré Plot for Entire Monitoring Period
Short Term Variation as Determined by Poincaré Plot Residuals
Variance – Measurement Methods & Results Shape of Variance in Vagal Control
Variance – Measurement Methods & ResultsData Variance > 1 σ: Vagal Cardiac Regulation
Discussion Limitations • Sample size • Linkage between Reduced Regulatory Variance and disease • Identification of Reduced Regulatory Variance indicating reduced adaptive capacity
Discussion Preliminary evidence of: • Reduced regulatory system variance of the vagal system in exhausted subjects during the workday that lasts into the hours following work • Reduced regulatory system variance of the vagal system in high strain subjects that seems to drop significantly during recovery hours • Clearly requires further study


![Aclinical Utility of measuring [IFX] & HACA in Pts with IBD](https://cdn2.slideserve.com/4958259/aclinical-utility-of-measuring-ifx-haca-in-pts-with-ibd-dt.jpg)