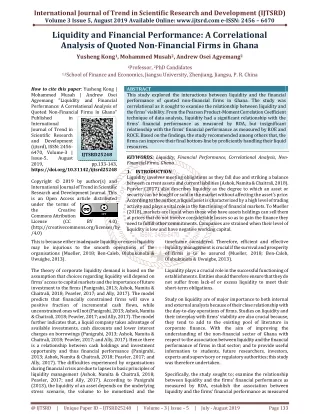
Download
1 / 23
230 likes | 326 Views
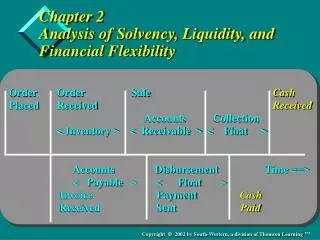
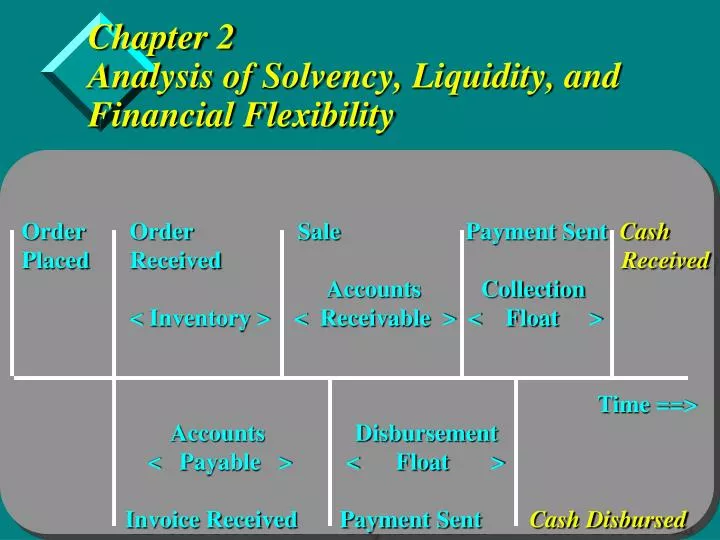
Chapter 2 Analysis of Solvency, Liquidity, and Financial Flexibility. Order Order Sale Payment Sent Cash Placed Received Received Accounts Collection

E N D
Chapter 2Analysis of Solvency, Liquidity, and Financial Flexibility • Order Order Sale Payment Sent Cash • Placed Received Received • Accounts Collection • < Inventory > < Receivable > < Float > • Time ==> • Accounts Disbursement • < Payable > < Float > • Invoice Received Payment Sent Cash Disbursed
Learning Objectives • Differentiate between solvency and liquidity ratios • Conduct a liquidity analysis • Assess a firm’s financial flexibility position
Financial Statements - Basic Source of Information • Balance Sheet • Income Statement • Statement of Cash Flows
Solvency Measures • Current Ratio • Quick Ratio • Net Working Capital • Net Liquid Balance • Working Capital Requirements
Current Ratio • Current assets • Current ratio = ------------------------- • Current liabilities • $8,924 • Current ratio2003= ------------ = 1.00 • $8,933 • 1999 2000 2001 2002 2003 • Current ratio 1.72 1.48 1.45 1.05 1.00
Quick Ratio • Current assets - Inventories • Quick ratio = ------------------------------------- • Current liabilities • $8,924 - $306 • Quick ratio = ------------------- = .96 • $8,933 • 1999 2000 2001 2002 2003 • Quick ratio 1.64 1.40 1.39 1.01 0.96
Net Working Capital Net working capital = CA - CL Net working capital = $8,924 - $8,933 = ($9) ($000,000) 1999 2000 2001 2002 2003 Net working capital $2,644 $2,489 $2,948 $358 ($9)
NWC and its Component Parts CA CL CA CL CA CL Cash Cash Cash A/P Mkt Sec A/P A/P Mkt Sec Mkt Sec A/R A/R N/P A/R N/P N/P Inventory Inventory Inventory CMLTD CMLTD CMLTD Prepaid Prepaid Prepaid Accruals Accruals Accruals NWC = CA - CL WCR = A/R + INV +Pre NLB = Cash + M/S - Accruals - A/P - N/P - CMLTD Error page 30 Net Working Capital Working Capital Requirements Net Liquid Balance
NWC and its Component Parts • Working Capital Requirements: • Index of Working Capital needs • Spontaneous uses/sources of funds over operating cycle • Expands/contracts with sales • If seasonal, finance with NLB or Short-term borrowing • If permanent due to growth, finance with Long-term capital • Negative indicates the cash cycle is a source of financing • Net Liquid Balance: • Measure of Liquidity rather than solvency • Current funds available to finance Short-term needs • Negative indicates need for external financing (reduced financial flexibility)
Working Capital Requirements to Sales • ($2,586+$306+$1,394) - ($5,989+$54+$1,458+$1,432) • WCR/S = ------------------------------------------------------------------- • $35,404 • ($4,647) • = ---------- = -.1313 • $35,404 • 1999 2000 2001 2002 2003 • WCR/S - 0.029 -0.065 -0.078 -0.114 -0.131
Net Liquid Balance • Net liquid balance = Cash + Equiv. - (N/P + CMLTD) • Net liquid balance = $4,638 - ($0) • = $4,638 • ($000,000) 1999 2000 2001 2002 2003 • Net liquid balance $3,181 $4,132 $5,438 $3,914 $4,638
What is Liquidity? • Ingredients • Time • Amount • Cost • Definition • Having enough financial resources to cover financial obligations in a timely manner with minimal costs
What is Liquidity - Examples • Amount and trend of internal cash flow • Aggregate available credit lines • Attractiveness of firm’s commercial paper and other financial instruments • Overall expertise of management
Liquidity Measures • Cash Flow From Operations • Cash Conversion Efficiency • Cash Conversion Period • Current Liquidity Index • Lambda
Cash Flow From Operations (p.33) ($ 000,000) 1999 2000 2001 2002 2003 CFFO $2,436 $3,926 $4,195 $3,797 $3,538
Cash Conversion Efficiency • ($ 000,000) 1999 2000 2001 2002 2003 • CFFO $2,436 $3,926 $4,195 $3,797 $3,538 • Revenues 18,243 25,265 31,888 31,168 35,404 • Operating profit 2,046 2,457 2,768 2,271 2,844 • Net profit 1,460 1,666 2,177 1,246 2,122 • (Percentage of sales) • Operating profit margin 11.21% 9.72 8.68 7.28 8.03 • Net profit margin 8.00% 6.59 6.82 3.99 5.99 • Cash conversion efficiency 13.35% 15.54 13.15 12.18 9.99 • Cash conversion efficiency = CFFO / Sales • Greater than Net profit margin indicates efficiency
Cash Conversion Chart Inventory Inventory Cash stocked sold received Days inventory held Days sales outstanding Days payables outstanding Cash conversion period Cash disbursed
Cash Conversion Period Calculations Cash conversion period = DIH + DSO - DPO (Days) 1999 2000 2001 2002 2003 DIH 7.10 7.17 5.79 3.99 3.87 DSO 49.64 38.69 33.14 26.57 26.66 ------- ------- ------- ------- ------- Operating cycle 56.74 45.86 38.93 30.56 30.53 DPO 62.34 64.92 62.07 72.87 75.79 ------- ------- ------- ------- ------- Cash conversion period -5.60 -19.06 -23.14 -42.31 -45.26
How Much Liquidity is Enough? • Solvency - a stock or balance perspective • Liquidity - a flow perspective • Liquidity management involves finding the right balance of stocks and flows
Current Liquidity Index • Cash assets t-1 + CFFO t • CLI = --------------------------------- • N/P t-1 + CMLTD t-1 • $4,638 + $3,538 • CLI = --------------------- = infinite • $0 + $0
Lambda • Initial liquid Total anticipated net cash flow • reserve + during the analysis horizon • Lambda = ------------------------------------------------------------------- • Uncertainty about the net cash flow during the • analysis horizon • [Cash + Marketable Securities + LoC] + OCF • Lambda = ------------------------------------------------------------------- • Standard Deviation of expected OCF • Std. Dev. ≈ Range/6
Financial Flexibility • Sustainable Growth Rate Concept: p. 42 • Uses = Sources • New Assets = New Equity + New Debt • gS(A/S) = m(S+gS)(1-d) + m(S+gS)(1-d)(D/E) • m(1-d)[1 + (D/E)] • g = ---------------------------------- • (A/S) - {m(1-d)[1 + (D/E)]} • .039977 x (1 - 0.00) x (1 + 1.8834) • g = ----------------------------------------------------- = 36.14% • .43426 - [0.039977 x (1 - 0.00)(1 + 1.8834)] • calculation uses 2002 data to calculate the sustainable 2003 g.
Summary • Chapter introduced basic concepts of: • solvency • liquidity • financial flexibility • Solvency: an accounting concept comparing assets to liabilities. • Liquidity: related to a firm’s ability to pay for its current obligations in a timely fashion with minimal costs. • Financial flexibility: related to a firm’s overall financial structure and if financial policies allows firm enough flexibility to take advantage of unforeseen opportunities.