Download
1 / 33
330 likes | 437 Views
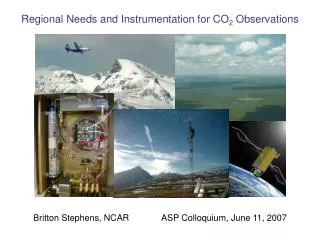
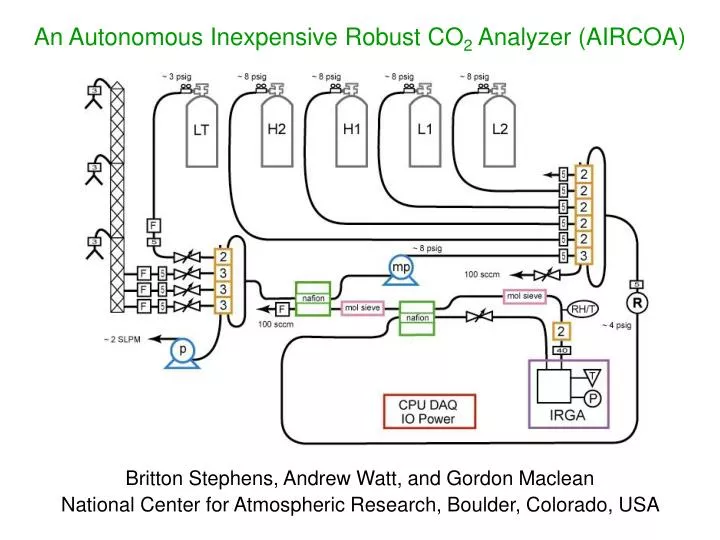
An Autonomous Inexpensive Robust CO 2 Analyzer (AIRCOA). Britton Stephens, Andrew Watt, and Gordon Maclean National Center for Atmospheric Research, Boulder, Colorado, USA. Using high frequency data makes signals bigger, but the annual-mean signals are still very small:.

E N D
An Autonomous Inexpensive Robust CO2 Analyzer (AIRCOA) Britton Stephens, Andrew Watt, and Gordon Maclean National Center for Atmospheric Research, Boulder, Colorado, USA
Using high frequency data makes signals bigger, but the annual-mean signals are still very small: To measure 0.2 GtCyr-1 source/sink to +/- 25% need to measure regional annual mean gradients to 0.1-0.2 ppm Flux footprint, in ppm(GtCyr-1)-1, for a 106 km2 chaparral region in the U.S. Southwest (Gloor et al., 1999).
Empirical temperature correction SPL 9/4-9/18 NWR 9/18
Drying system monitoring A change of 0.5% RH is approximately 300 ppm H2O, which would cause a dilution error of 0.1 ppm in CO2
Nafion absorption effect Flow pulled through Nafion went from 300 to 50 sccm at t = 30 sec
Automated (4- or 8-hourly) leak checks A positive trend of 0.3 kPa/min would be a leak rate of 0.1 sccm which if 100 ppm different would cause a 0.1 ppm bias
Regulator oven tests Three cylinders were in the oven and one (green dots) was not
Laboratory intercomparisons Laboratory offsets less than 0.05 ppm (1-sigma = 0.13 ppm) Field surveillance tanks 2.5-month average field differences from assigned values 0.01 to 0.10 ppm (1-sigma = 0.10 to 0.13 ppm)
Automated web-based output http://www.eol.ucar.edu/~stephens/RACCOON