1 / 12

Florence Nightingale’s graph

Florence Nightingale’s graph.

rhoswen
Download Presentation

Florence Nightingale’s graph

An Image/Link below is provided (as is) to download presentation Download Policy: Content on the Website is provided to you AS IS for your information and personal use and may not be sold / licensed / shared on other websites without getting consent from its author. Content is provided to you AS IS for your information and personal use only. Download presentation by click this link. While downloading, if for some reason you are not able to download a presentation, the publisher may have deleted the file from their server. During download, if you can't get a presentation, the file might be deleted by the publisher.

E N D

Presentation Transcript


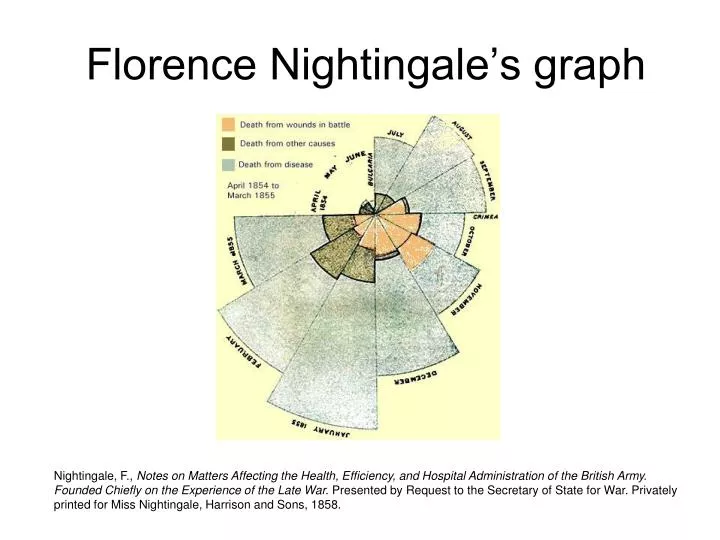
  1. Florence Nightingale’s graph Nightingale, F., Notes on Matters Affecting the Health, Efficiency, and Hospital Administration of the British Army. Founded Chiefly on the Experience of the Late War. Presented by Request to the Secretary of State for War. Privately printed for Miss Nightingale, Harrison and Sons, 1858.

  2. Charles Joseph Minard “the best statistical graphic ever drawn”. 422,000 – 10,000

  3. 1821 by William Playfair

  4. Playfair

  5. Dr. John Snow -cholera Ghost Map Steven Johnson

  6. Charles Franklin Nov. 1st 2008 Pollster.com Nate Silver 538.com

  7. Scatterplot of age vs height

  8. Stem and Leaf

More Related