Download
1 / 9
490 likes | 976 Views
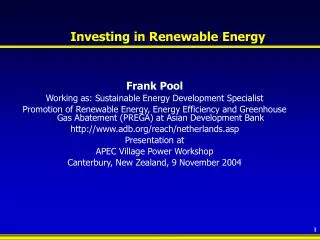
Standard Chartered Bank Renewable Energy & Environmental Finance. International footprint Focus on Asia, Africa and the Middle East. Standard Chartered Bank – 150 years and Growing. Listed on London and Hong Kong Stock Exchange Focus on Asia, Africa and Middle East

E N D
Standard Chartered Bank Renewable Energy & Environmental Finance
International footprint Focus on Asia, Africa and the Middle East Standard Chartered Bank – 150 years and Growing • Listed on London and Hong Kong Stock Exchange • Focus on Asia, Africa and Middle East • Presence in London/EU, New York and Americas • Footprint covers 70 countries with 73,000 employees and 115 nationalities • “One-stop shop" bank across debt, M&A, equity and principal (250 professionals) • 15,000 banking client relationships • Dedicated Renewable Energy & Environmental Finance (REEF) teams in London and Singapore
SCB’s Approach to Renewable Energy & Environmental Finance Renewable Energy - Key Pillar of REEF “REEF” – Global Issues / Local Deals • SCB footprint • 70% of population / 60% of energy growth • 75% of CO2 growth • +/- 50% of key RE resource Agriculture / Forestry Land use, Forestry, Bio fuels, Biomass Water - Key input to Agri. Renewable Energy + Environmental Finance Tech, capital, Products Capital, Products Phase II Sector / Policy is Global Phase I Water/ Waste Renewable Energy (RE) • Energy for water distribution • Water in energy generation • Europe • Policy support • Implementation experience • US • Policy Leader • “Green” stimulus • “Best in class” Technology and VC / PE Phase I : REEF strategy (present) focus Phase II : REEF strategy (expanded)focus “You don’t solve problems using the same kind of thinking that got you into the problems in the first place”Albert Einstein
SCB Footprint – Endowed with Abundant Solar Energy • SOLAR ENERGY • Regions circled have solar potential of 261,649TWh • Global Electricity Generation in 2008 was 20,202TWh i.e. solar energy potential in selected regions 13x higher • Installed capacity estimated for 2008 of ~15 GW** - under 1% of the solar resource potential • Compelling scale and cost characteristics • Market growing at 40% - 50% CAGR • Global policy support strengthened with the government stimulus packages (US, China, South Korea, etc) • STANDARD CHARTERED BANK • 60% of the global solar energy resource is in Standard Chartered Bank’s footprint • Many of our markets suffer from chronic under investment / undersupply in / of energy • Solar energy generating assets require significant project finance – core strength of Standard Chartered Bank • Many of our clients, including corporates, financial sponsors, and development organisations are interested in solar SCB Footprint * Source: World Energy Assessment: Energy and the Challenge of Sustainability, UN/UNDP/World Energy Council, 2005 ** Source: New Energy Finance "I'd put my money on the sun and solar energy. What a source of power! I hope we don't have to wait till oil and coal run out before we tackle that"Thomas Edison (1931)
Solar Energy Sector – Markets & Applications INSTALLATION SIZE • World solar PV market installations reached a record high of ~6.0 GW in 2008 and cumulative PV power installed totalled ~15 GW compared to ~9 GW in 2007 • Europe leads the way with ~9 GW representing ~65% of the global cumulative PV installed capacity (with Japan and the US at 2.1 GW and 1.2 GW, respectively) • Current solar market so far dominated by small scale, residential PV installations • Increased government support – particularly in the form of feed-in tariffs – is driving momentum in the utility scale installations (PV and Concentrated Solar Power (“CSP”) in particular) MARKETS SERVED RESIDENTIAL COMMERCIAL UTILITY PV CSP TECHNOLOGY ~ 1.7 GW (28%) ~ 2.8GW (45%) ~ 1.6 GW (27%) ~ 1.2 GW (26%) ~ 2.0 GW (44%) ~ 1.4 GW (30%) US, Spain Germany Spain, Germany Distributed generation: <10KW – 1MW; Central Generation: <1MW - >100MW (i) Residential:Residential Buildings (ii) Commercial:Commercial / Industrial Buildings (iii) Utility: Large Scale Source: Prometheus Institute; Solarbuzz; Barclays Capital Research; Standard Chartered Bank Analysis
CSP Technologies ALTERNATIVE CSP TECHNOLOGIES • Scalability of CSP technology will drive the global increase in solar energy installed capacity • Levelised Cost Of Energy (LCOE) – determining factor in establishing leading CSP technology and vis-à-vis other renewable energy technologies (e.g., become the First Solar of CSP) • Flexibility around water, land, and components are key to the SES story / strategy • Storage potential of most CSP technologies represents a comparative advantage to wind energy Source: Technology Innovation Report, Concentrated Solar Thermal, Cleantech Group, 2008; DLR; SCB research
Opportunities for CSP market development • Supportive Regulatory Regimes • Regimes with Strong policy support in the form of PPA’s, FIT’s and wide ranging initiatives to promote renewable energy and in particular solar energy • US, West Coast – California • Spain • Italy, Portugal, Greece • Australia 8.0 Egypt & Libya (7.67) California (7.50) Jordan & Algeria (7.40) Morocco (7.12) Mexico (7.00) Saudi Arabia (6.85) Tunisia (6.58) Spain (6.16) UAE (6.03) Portugal (6.03) 6.0 Australia (5.89) Energy Density kWh / m2 / day Greece & Italy (5.48) Turkey (5.48) • Attractive Solar Resources • High Energy Density Levels – however with current low to medium level of Government Support • Egypt • Morocco • Algeria • Tunisia • Gulf Region Germany (4.58) 4.0 Government Support High Low Opportunity to strategically engage Development Organisations Key North African Markets Source:Concentrating Solar Power for the Mediterranean Region, DLR, 2005 (figures are average for country)