Download
1 / 52
560 likes | 828 Views
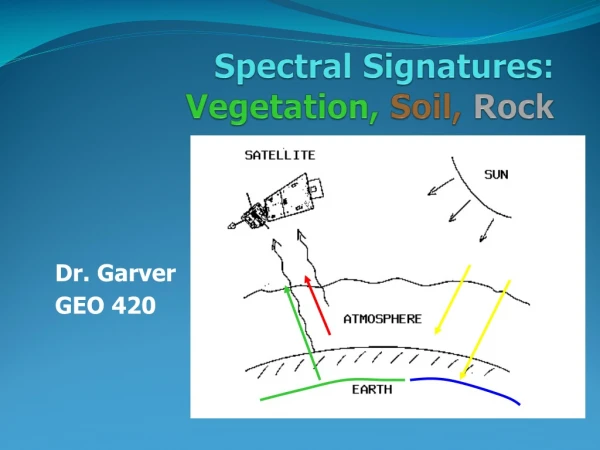
Spectral Signatures. Hyperspectral Imagery: MISI. Radiation Propagation. Energy Paths. Radiation Propagation. The spectral radiance reaching an aerial or satellite sensor in the UV through LWIR region can be expressed in simplified form as:. =. +. +. +. +. +. L. L. L. L. L. L.

E N D
Hyperspectral Imagery: MISI Spectral Sources
Radiation Propagation Energy Paths Spectral Sources
Radiation Propagation The spectral radiance reaching an aerial or satellite sensor in the UV through LWIR region can be expressed in simplified form as: = + + + + + L L L L L L L l A B C D E F ¢ E = t t s + t + + e t + t + S L cos r L r L L L r L l 1 2 ds 2 us T 2 de 2 ue p Spectral Sources
Radiation Propagation In the reflective region (0.4-3 m) this can be approximated as: and in the LWIR and the MWIR at night an approximate expression is: = + + L L L L l A B C = + + L L L L l D E f Spectral Sources
¥ ò ˆ = l l L L R ( ) d l 0 R ˆ = R l ( ) R max Radiation Propagation The effective radiance (L) reaching a sensor for a given channel can be expressed as: where: () is the peak normalized spectral response of the sensor i.e. ˆ R Spectral Sources
ò ò = = l l l L L L R ( ) d / R ( ) d l l l eff Radiation Propagation The effective in band radiance is more commonly used in imaging spectroscopy and is expressed as: l Spectral Sources
Radiation Propagation Spectral Sources
Characteristics of Spectral Data Spectral Sources
Characteristics of Spectral data 1.0 • solids • liquids • gasses Grass Brick asphalt roofing Spectral Sources
Characteristics of Spectral data solids liquids gasses 0.50 Irondequoit Bay Genesee River Lake Ontario Spectral Sources
Characteristics of Spectral data gasses WAVENUMBER [cm-1] WAVENUMBER [cm-1] WAVENUMBER [cm-1] Spectral Sources
1 = v l [cm] wave number Often in MWIR and LWIR but particularly when studying gases we use wave numbers as a means of expressing spectral values. The wave number is expressed as: i.e. how many wavelengths fit in 1 cm
1 - 1 = = v 3333 cm - 6 10 m 100 cm m × × 3 m m m m 1 - 1 = = v 1000 cm - 4 10 cm m × 10 m m m wave number So 3 m is for 10 m Spectral Sources
Absorption spectra of various atmospheric constituents H2O O3 CO Spectral Sources
Absorption spectra of various atmospheric constituents CO2 CH4 N2O Spectral Sources
Absorption spectra of various atmospheric constituents O2 Overall Atmospheric Transmission Spectral Sources
Characteristics of Spectral data:Sources of Absorption Spectra • electron transition • rotation and vibration • harmonics Spectral Sources
Signatures Below 1 m In minerals, the absorption features are largely influenced by transition metals, particularly iron which is very common. Charge transfer bands that result from electron exchange between neighboring metal ions create strong absorption features in the UV. The wings of these bands account for the general increase in reflectance with wavelength in the visible for most minerals Spectral Sources
Signatures (cont’d) (from Pieters & Englert,1993) Spectral Sources
Signatures (cont’d) • Combination bending and stretching overtones of the fundamental OH vibration at 2.74 m cause features between 2.1 and 2.4 m. Overtones for H2O and CO3 also occur in this region. • As we move through SWIR and into the MWIR, the spectra are rich with overtones and fundamentals of vibrational and rotational transitions. However, the thermal signature begins to mask absorption features and must be dealt with before emissive/absorptive spectra can be clearly observed. Spectral Sources
Spectroscopy of Materials • Observable spectra in the VIS-SWIR may be due to: • electron transitions in molecules and crystals • vibration transitions in molecules and crystals • electronic transition between atoms • Electronic transitions are generally in the VIS-NIR • Vibrational transitions are usually further into the IR with overtones and combinations in the NIR and SWIR. Spectral Sources
Spectroscopy of Materials (cont’d) Fundamental vibrational modes of simple molecules and molecular ions. (from Pieters & Englert,1993) Spectral Sources
Spectroscopy of Materials (cont’d) Overtones occur at approximately linear combinations of the fundamental frequencies, e.g., 1 + 1, or 1 + 2 Since these are not perfectly free harmonic oscillations the overtones are usually shifted to slightly longer wavelengths than simple addition would predict. Spectral Sources
Spectroscopy of Materials (cont’d) Concentration of material tends to be proportional to absorption but confusion factors can arise caused by, for example, stronger returns from fine particulates dispersed over the matrix. Particularly when the materials are optically interacting any spectral combination may be highly non-linear (e.g., an intimate mixture). Spectral Sources
Characteristics of Spectral data: Changes in absorption features with state changes Vegetation &Snow Spectra Examples of a calculated water vapor transmittance spectrum and measured reflectance spectra of vegetation and snow. Spectral Sources
Example reflection spectra32% reflector through different atmospheres reflectance reflectance DC DC observed radiance observed radiance Spectral Sources
Example reflection spectra32% reflectance through different atmospheres reflectance reflectance DC DC observed radiance observed radiance Spectral Sources
Scattering Theory The shape of the absorption feature when expressed as reflectance vs. energy or apparent absorption is approximately Gaussian. The continuum must be removed by dividing the reflectance spectrum by an estimate of the continuum or subtracting an estimate of the log of the continuum from the log (lnr) of the reflectance spectrum. Spectral Sources
Scattering Theory (cont’d) The spectra of pure montmorillonite (top) and mixtures of montmorillonite plus carbon black (0.5 wt % carbon black, middle; 2.0 wt % carbon black, bottom) (from Clark & Rousch1984) Spectral Sources
Scattering Theory (cont’d) The absorption spectra can then be characterized by fitting a Gaussian to the specific absorption feature. Can estimate source of other absorption features, curve fit and divide them out or simply curve fit (often straight line) locally and divide to estimate the absorption feature. Spectral Sources
D - D D D D C B C C B Scattering Theory (cont’d) Band depth defined as: D = __________ where is reflectance of continuum at band center and is reflectance at band center Spectral Sources
Scattering Theory Spectral Sources
Characteristics of Spectral data:Sample Spectra Spectral Sources
Spectroscopy of Minerals Wavelength Wavelength Figure 4a. Spectral Sources
Spectroscopy of Minerals (cont’d) Spectral Sources
Spectroscopy of Minerals (cont’d) Spectral Sources
Spectroscopy of Minerals (cont’d) Spectral Sources
Spectroscopy of Minerals (cont’d) Spectral Sources
Spectroscopy of Minerals (cont’d) Spectral Sources
Spectroscopy of Minerals (cont’d) Spectral Sources
Spectroscopy of Minerals (cont’d) Figure 5a. The reflectance spectra of talc as a function of spectral resolution in 1.4 micro-meter region. Spectral Sources
Hyperspectral Notes Some sample spectra of organic compounds are shown in Figure 3.17 and absorption lines associated with transitions listed in Table 3.2. Spectral Sources
sample spectra of organic compounds and absorption lines associated with transitions listed in next table. Hyperspectral Fig 3.17. Spectra of organic compounds Spectral Sources
Hyperspectral Notes (cont’d) Table 3.2. NIR absorptions due to vibrational transitions of organic molecules Spectral Sources
Hyperspectral Notes (cont’d) Effect of particle size: Reflection can be thought of as a combination of surface (specular) reflection and volume (diffuse or scattered) reflection. In the diffuse case, some of the flux penetrates medium and is partially absorbed before being scattered back to the surface. Spectral Sources
Hyperspectral Notes (cont’d) In general, for a highly reflecting (weakly absorbing) material: increasing grain size will decrease the reflectance (increase transmissive interactions and absorption line strength). Spectral Sources
Hyperspectral Notes (cont’d) Fig. 3.18 Variation in reflectance and absorption band depth with variations in particle size of clacite (Iceland spar), a high albedo mineral. Spectral Sources
Hyperspectral Notes (cont’d) In strongly absorbing materials, surface reflection may dominate. Depth of penetration is very shallow (little diffuse reflection) reflectivity decreases with decreasing particle (more absorbing centers available). Absorption band strength is deepest when particle size is approximately equal to the optical depth (which is, of course, wavelength dependent). Spectral Sources
Hyperspectral Notes (cont’d) Fig. 3.19. Variation in reflection properties with particle size for a strongly absorbing material (pyrite, FeS2). Spectral Sources