Download
1 / 1
30 likes | 193 Views
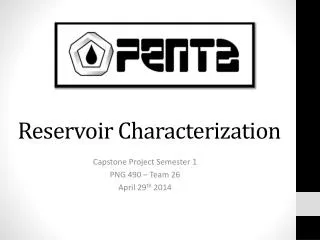
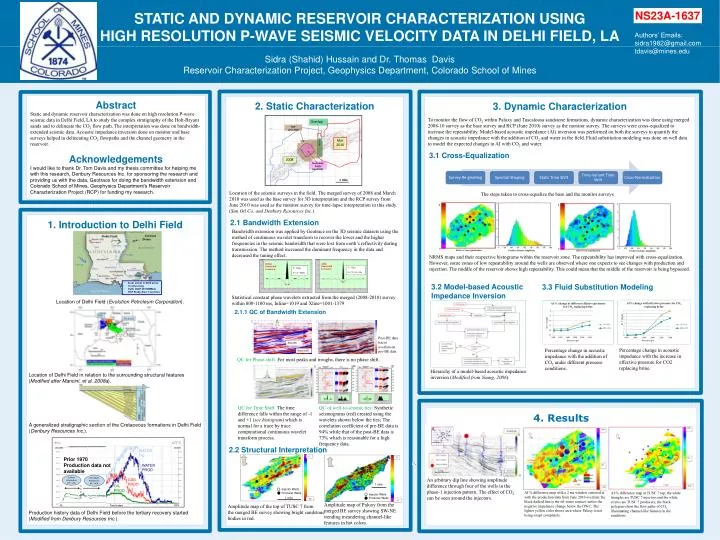
STATIC AND DYNAMIC RESERVOIR CHARACTERIZATION USING HIGH RESOLUTION P-WAVE SEISMIC VELOCITY DATA IN DELHI FIELD, LA. NS23A-1637. MCF/D. MCF/D. BPD. BPD. 20,000. 20,000. 100,000. 100,000. WATER INJ. WATER INJ. Authors’ Emails: sidra1982@gmail.com tdavis@mines.edu. Prior 1970

E N D
STATIC AND DYNAMIC RESERVOIR CHARACTERIZATION USING HIGH RESOLUTION P-WAVE SEISMIC VELOCITY DATA IN DELHI FIELD, LA NS23A-1637 MCF/D MCF/D BPD BPD 20,000 20,000 100,000 100,000 WATER INJ WATER INJ Authors’ Emails: sidra1982@gmail.com tdavis@mines.edu Prior 1970 Production data not available Prior 1970 Production data not available WATER PROD WATER PROD Sidra (Shahid) Hussain and Dr. Thomas Davis Reservoir Characterization Project, Geophysics Department, Colorado School of Mines Primary Production RF ~14% Primary Production RF ~14% Secondary Production RF ~ 40% Secondary Production RF ~ 40% GAS PROD GAS PROD OIL PROD OIL PROD 65 65 50 50 60 60 55 55 45 45 0 0 2005 2005 Abstract Static and dynamic reservoir characterization was done on high resolution P-wave seismic data in Delhi Field, LA to study the complex stratigraphy of the Holt-Bryant sands and to delineate the CO2 flow path. The interpretation was done on bandwidth-extended seismic data. Acoustic impedance inversion done on monitor and base surveys helped in delineating CO2flowpaths and the channel geometry in the reservoir. Acknowledgements I would like to thank Dr. Tom Davis and my thesis committee for helping me with this research, Denbury Resources Inc. for sponsoring the research and providing us with the data, Geotrace for doing the bandwidth extension and Colorado School of Mines, Geophysics Department’s Reservoir Characterization Project (RCP) for funding my research. Time in years Time in years 2. Static Characterization • 3. Dynamic Characterization To monitor the flow of CO2 within Paluxy and Tuscaloosa sandstone formations, dynamic characterization was done using merged 2008-10 survey as the base survey and RCP (June 2010) survey as the monitor survey. The surveys were cross-equalized to increase the repeatability. Model-based acoustic impedance (AI) inversion was performed on both the surveys to quantify the changes in acoustic impedance with the addition of CO2 and water in the field. Fluid substitution modeling was done on well data to model the expected changes in AI with CO2and water. 3.1 Cross-Equalization Location of the seismic surveys in the field. The merged survey of 2008 and March 2010 was used as the base survey for 3D interpretation and the RCP survey from June 2010 was used as the monitor survey for time-lapse interpretation in this study. (Sun Oil Co. and Denbury Resources Inc.) The steps taken to cross-equalize the base and the monitor surveys 2 2 2.1 Bandwidth Extension 1. Introduction to Delhi Field Bandwidth extension was applied by Geotrace on the 3D seismic datasets using the method of continuous wavelet transform to recover the lower and the higher frequencies in the seismic bandwidth that were lost from earth’s reflectivity during transmission. The method increased the dominant frequency in the data and decreased the tuning effect. After Bandwidth Extension Before Bandwidth Extension Overlap T= 12ms F=1/T=83.3 Hz T= 20ms F=1/T=50Hz RCP June 2010 0 0 Before Cross-equalization Positive Seismic Amplitude After Cross-equalization Positive Seismic Amplitude NRMS maps and their respective histograms within the reservoir zone. The repeatability has improved with cross-equalization. However, some zones of low repeatability around the wells are observed where one expects to see changes with production and injection. The middle of the reservoir shows high repeatability. This could mean that the middle of the reservoir is being bypassed. Mar 2010 2008 3.2 Model-based Acoustic Impedance Inversion 3.3 Fluid Substitution Modeling Permanent Patch (Jan 2010) Statistical constant phase wavelets extracted from the merged (2008-2010) survey within 800-1100 ms, Inline=1019 and Xline=1001-1379 1 mile Location of Delhi Field (Evolution Petroleum Corporation). 2.1.1 QC of Bandwidth Extension • Areal extent is 6200 acres • 15 miles long • Delhi OOIP 357 MMBbls • RCP Study Area 7 sq miles GR log Post-BE data traces overlain on pre-BE data After BE Percentage change in acoustic impedance with the increase in effective pressure for CO2 replacing brine. Percentage change in acoustic impedance with the addition of CO2 under different pressure conditions. Before BE QC for Phase-shift: For most peaks and troughs, there is no phase shift. Hierarchy of a model-based acoustic impedance inversion (Modified from Young, 2006). Location of Delhi Field in relation to the surrounding structural features (Modified after Mancini, et al. 2008a). QC for Time Shift: The time difference falls within the range of -1 and +1 (see histogram) which is normal for a trace by trace computational continuous wavelet transform process. QC of well-to-seismic ties: Synthetic seismograms (red) created using the wavelets shown below the ties; The correlation coefficient of pre-BE data is 94% while that of the post-BE data is 73% which is reasonable for a high frequency data. 4. Results A generalized stratigraphic section of the Cretaceous formations in Delhi Field (Denbury Resources Inc.). 2.2 Structural Interpretation 35 0 N N An arbitrary dip line showing amplitude difference through four of the wells in the phase-1 injection pattern. The effect of CO2 can be seen around the injectors. 1 mile AI % difference map with a 2 ms window centered at with the production data from June 2010 overlain; the black dashed line is the oil-water contact; notice the negative impedance change below the OWC. The lighter yellow color shows area where Paluxy is not being swept completely. AI % difference map at TUSC 7 top; the white triangles are TUSC 7 injectors and the white circles are TUSC 7 producers; the black polygons show the flow paths of CO2 illuminating channel-like features in the sandstone. Injector Wells Injector Wells Producer Wells Producer Wells -4 1 mile -25 Amplitude map of Paluxyfrom the merged BE survey showing SW-NE trending meandering channel-like features in hot colors. Amplitude map of the top of TUSC 7 from the merged BE survey showing bright sandstone bodies in red. Production history data of Delhi Field before the tertiary recovery started (Modified from Denbury Resources Inc.).