Download

1 / 15
150 likes | 335 Views
Computing Estimation of Entropy of Binary Sequences by Using Decision Diagrams. Stanislav Stankovi ć Rovio Entertainment, Ltd., FIN-33210 Tampere, Finland. Basic Definitions. - an alphabet. - the set of all finite words over . - the rate of a word occuring in the sequence.

E N D
Computing Estimation of Entropy of Binary Sequences by Using Decision Diagrams StanislavStanković Rovio Entertainment, Ltd., FIN-33210 Tampere, Finland
Basic Definitions - an alphabet - the set of all finite words over - the rate of a wordoccuring in the sequence Problem Computingrates of occurences Ryabko, B., Astola, J., “Universal codes as a basis for time series testing”, Statistical Methodology, Vol. 3, 2006, 375–397
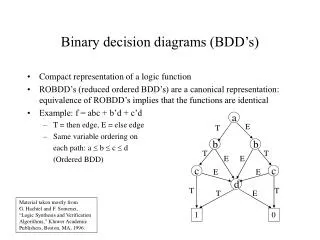
Computing Estimation of Entropy Windowingmechanism (00)0100 → 0(00)100 → 00(01)00 → 000(10)0 → 0001(00) Bruteforcemethod Complexity of calculation depends on the length of the sequence No properties of the sequencetaken into account Decisiondiagramsare a data structure for representation of dDiscretefunctionswhosecompactness is due to the properties of functionsrepresented
BDD n = 3 Level 1 Level 2 Level 3 Level 4
Reduction Rules BDD 1. Delete nodes whose both outgoing edges point to the same node. The input edge of the deleted node connect to the corresponding successing node. 2. Share isomorphic subtrees. _ xÅx = 1 xÚx = x Bit-level
Estimation of Entropy over BDD Correction of +1 should be made if the given substring occurs exactly at the split of two halves of the given vector so that its first character remains in the first half of the string while the last ends up in the second half Recursivesplitting of segmentsuntilsegments of k = 2reached Recursivestructure of Binarydecisiontrees
Subsequence, subtrees, and paths The exact number a certain subsequence voccurs in a given vector fis equivalent to the number of paths that point to the node which is the root of the subdiagram representing the substring v The number of identical subsequences is equal to the weighted sum of incoming edges to the node in BDD The weight associated with a particular edge equals wi= 2l, where lis the difference of the level between the parent and the considered node
Method of Computing To calculate the number of occurrences of all possible substrings of length k = 2in a binary vector, we need to iterate through all the nodes at n-th level of decision diagram and calculate the number of the corresponding paths as the described weighted sum Before we can perform any calculation, we need to extend the diagram with virtual nodes at each place where an edge intersects with n-th level. Virtual nodes correspond to substrings representing pairs of identical binary values v = 00,v = 11, which possibly exist in f
Subvectors For a given binary vector, a subvector of length k = 2starting at position i is determined by the last character of preceding subvectorat the position i− 1,and the first character of the following subvector at the position i+ 1 Example ...1100... vi−1 = 11 vi+1 = 00 vi = 10 LUT of indices for k = 2 00 01 10 11 00 00 00 01 01 01 10 10 11 11 10 00 00 01 01 11 10 10 11 11 00 = 0, 01 = 1, 10 = 2, 11 = 3
Subvectors at BDD If subvectorsvi−1andvi+1are represented by adjacent nodes atthe n−1 level in the decision diagram, substring vicorresponds to their common parent node
Algorithm To completely determine the occurrence rates of all subvectors of a given vector, we need to visit all the nodes in the diagram. The complete algorithm therefore represents an inordertraversal of the decision diagram, with the following additional steps performed at each node If the level of the current node is < n+ 1, 1) Determine to which subvector the node corresponds, 2) Increase the value of appropriate counter by the weight of the corresponding incoming edge, 3) Store the index of the counter. If the level of the current node is > n+ 1, 1) based on indices stored in children nodes, determine the preceding and following substring, 2) increase the appropriate counter.
Example ν(v1) = ν(01) = 5 + 1 = 6,ν(v2) = ν(10) = 0 + 5 = 5, ν(v1) = ν(11) = 2+2 = 4 The methodcanbeextended to anyk = 2j Memoryrequirements(2j´2j)LUT to storepossiblecombinations of elements of subvectors
Experiments f BDD Standard BW_0 5XP_10 MISEX1_0 RD84_0 APEX4_0 APEX4_10 EX1010_0 MISEX3_0 MISEX3_3 MISEX3_4 10 12 66 4 258 6 10 8194 514 4 31 127 255 255 511 511 1023 16383 16383 16383
Acknowledgments Acknowledgments