Download
1 / 51
510 likes | 531 Views
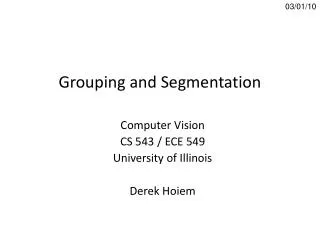
Segmentation by clustering: normalized cut. T-11 Computer Vision University of Ioannina Christophoros Nikou. Images and slides from: James Hayes, Brown University, Computer Vision course D. Forsyth and J. Ponce. Computer Vision: A Modern Approach, Prentice Hall, 2003.

E N D
Segmentation by clustering: normalized cut T-11 Computer Vision University of Ioannina Christophoros Nikou Images and slides from: James Hayes, Brown University, Computer Vision course D. Forsyth and J. Ponce. Computer Vision: A Modern Approach, Prentice Hall, 2003. Computer Vision course by Svetlana Lazebnik, University of North Carolina at Chapel Hill. Computer Vision course by Kristen Grauman, University of Texas at Austin.
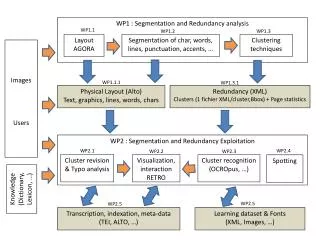
j wij i Images as graphs • Node for every pixel. • Edge between every pair of pixels (or every pair of “sufficiently close” pixels). • Each edge is weighted by the affinity or similarity of the two nodes. Source: S. Seitz
j wij i Segmentation by graph partitioning • Cut the graph into segments. • Delete links that cross between segments. • Easiest to break links that have low affinity. • similar pixels should be in the same segments. • dissimilar pixels should be in different segments. A B C Source: S. Seitz
Measuring affinity • Each pixel is represented by a feature vector, and a distance function is defined. • We may convert the distance between two feature vectors into an affinity with the help of a generalized Gaussian kernel. The weight of the edge becomes:
Scale affects affinity • Small σ: group nearby points. • Large σ: group distant points. σ=0.1 σ=0.2 σ=1.0
Graph cut • Set of edges whose removal makes a graph disconnected. • Cost of a cut: sum of weights of cut edges. • A graph cut gives us a segmentation • What is a “good” graph cut and how do we find one? B A Source: S. Seitz
Minimum cut • We can have a segmentation by finding the minimum cut in a graph • Efficient algorithms exist (Cormen et al. 2009) Minimum cut example
Minimum cut • We can have a segmentation by finding the minimum cut in a graph • Efficient algorithms exist (Cormen et al. 2009) Minimum cut example
Cuts with lesser weight than the ideal cut Ideal Cut Minimum cut • Drawback: minimum cut tends to cut off very small, isolated components. * Slide from Khurram Hassan-Shafique CAP5415 Computer Vision 2003
Agglomerative clustering with a graph • Image as a weighted graphwith edges between adjacent pixels measuring dissimilarity • Large weight means different pixels • Every pixel forms a cluster • Merge similar clusters until there are is no need to continue • We need • Distance (difference) between two clusters for merging the closest ones • An index of how coherent a cluster is in order to stop clustering
Agglomerative clustering with a graph • The difference between two clusters is the minimum weight edge connecting the clusters: • The internal difference of a cluster is the largest weight of the minimum spanning tree of the cluster: • Fast algorithms exist for computing the minimum spanning tree (Cormen et al. 2009).
Agglomerative clustering with a graph • The main idea is to merge clusters whose distance is smaller w.r.t. the internal distance of each one separately • Small clusters • internal difference may be zero • Very small clusters may have too low internal distances making the comparison problematic • In (Felzenswalb and Huttenlocher 2004) a function of two clusters is proposed: τ (C)is a term that biases int(C) upwards for small clusters, e.g. τ(C)=cnst/|C |
Divisive clustering with a graph • Useful in foreground/background segmentation • We dispose a labeled map of pixels • Foreground • Background • Unknown • We build models for foreground and background • Goal:label the unknown pixels as foreground or background • Important constraints on the labels • A pixel that looks like the foreground (background) examples should get a foreground (background) label • Neighboring pixels should tend to have similar labels
Divisive clustering with a graph • Boykov and Jolly (2001) rephrased the problem as the minimization of an energy function • δi=-1 if the i-th pixel is background • δi=1 if the i-th pixel is foreground • df(pi) a function comparing a pixel to foreground model • db(pi) a function comparing a pixel to background model • B (pi, pj) a non-negative symmetric function encouraging neighboring pixels to have similar labels
Divisive clustering with a graph • Hard minimization because it is a combinatorial problem (δican take only two values). • It may be rephrased as minimizing a cut on a graph (graph cut) • min-cut/max flow problem. • The problem is polynomial and several specialized algorithms exist • We will study it in Markov Random Field (MRF) models
Divisive clustering with a graph Source (foreground) Cost to assign to foreground Cost to split nodes Cost to assign to background Sink (background) Figure: D. Hoeim, U. of Illinois
Divisive clustering with a graph Cost to assign to foreground Source (foreground) Cost to split nodes Cost to assign to background Sink (background) Figure: D. Hoeim, U. of Illinois
Divisive clustering with a graph Moderately straightforward examples Figure: Microsoft Research
Divisive clustering with a graph Camouflage and low contrast Fine structure Harder case More difficult examples Figure: Microsoft Research
Good foreground and background models are not generally available Min cut will separate small groups of pixels Consider the image as a graph G(V,E) with V being the set of vertices (pixels i=1,…N). E arethe edges. W is the affinity matrix between pixels. We want to segment it into two segments: segment A containing “similar pixels” and segment and B containing the rest of the image. Eigenvectors and Segmentation
We allow elements associated with cluster A to have a continuous weight ai. Large value for ai means a strong connection to the cluster. A good cluster is one with elements having: large weights ai. large values between them in the affinity matrix W. Eigenvectors and Segmentation
An objective function expressing this assumption is: Eigenvectors and Segmentation • E(a) is a sum of products of the form: • ai : association of element i with the cluster. • wij : affinity between elements i and j. • aj : association of element j with the cluster.
We now estimate vector a maximizing: Eigenvectors and Segmentation subject to: because scaling a scales the objective function. • The Lagrangian is leading to the solution: which is an eigenvector of W. The one maximizing J corresponds to the largest eigenvalue of W.
Vector a is further thresholded Elements of a over the threshold belong to the cluster. Elements of a below the threshold are not associated with the cluster. More (M) segments may be obtained by Recursively clustering the pixels associated with small values of vector a, or Computing the first M eigenvectors of W and grouping their M -dimensional features (e.g. by K-means). Eigenvectors and Segmentation
Ideally, we expect that if here are M significant clusters, the eigenvectors corresponding to the M largest eigenvalues each represent a segment. They would be vectors of a block padded with zeros. Eigenvectors and Segmentation 80 2D points and the first 4 eigenvectors of the affinity matrix.
The presented technique may be reformulated in terms of an association between the elements of two clusters to be maximized: Average Association yielding the solution of the eigenvector corresponding to the largest eigenvalue of W:
A similar approach minimizes the sum of edges to be cut in order to form two segments: Average Cut
Average Cut • The associated cost function to be minimized, with respect to a, is: • If pixels iand j are similar, that is wijis large, then if they do not belong to the same cluster, E(a) is heavily penalized. • If the pixels are not similar, they should be assigned to different clusters and this difference is multiplied by a small value of wij
Average Cut Define the diagonal matrix D with elements the sum of weights arriving at the i-th pixel:
Average Cut • Estimating vector a minimizing: subject to: yields the solution of the eigenvector corresponding to the (second) smallesteigenvalue of D-W:
Normalized cut • Average association tends to find ‘tight” clusters in the graph. • Average cut tends to keep a balance but it is not always guaranteed that that the two partitions will have a tight group similarity. • The normalized cut (Ncut) tries to keep a balance between tightening and splitting clusters • It may be shown that both of the previous methods are approximations of Ncut. J. Shi and J. Malik. Normalized cuts and image segmentation. PAMI 2000
Normalized cut • Ncut is defined as: • The cost of the cut is a small fraction of the total affinity in each group. • Minimization is NP-hard. An approximate solution may be found as in the previous cases.
Normalized cut • Create vector a having components the weights associating each pixel with a cluster. • Each ai is a cluster indicator of the corresponding pixel.
As before, we may show that: Normalized Cut
Also, Normalized Cut
We now combine Normalized Cut with in
Normalized Cut It turns out that the Ncut objective function is equivalent to minimizing: or minimizing: which corresponds to finding the eigenvector correponding to the (second) smallest eigenvalue of
Normalized Cut Average Cut Average Association Normalized cut
Normalized Cut The magnitudes of the eigenvalues provide a hint for the number of clusters.
Normalized Cut • Superpixels. • Unsupervised bottom-up process. X. Ren and J. Malik. Learning a classification model for segmentation. ICCV 2003.
Using texture features for segmentation • How to segment images that are a “mosaic of textures”?
Using texture features for segmentation • Convolve image with a bank of filters. J. Malik, S. Belongie, T. Leung and J. Shi. "Contour and Texture Analysis for Image Segmentation". IJCV 43(1),7-27,2001.
Using texture features for segmentation • Find textons by clustering vectors of filter bank outputs. Image Texton map J. Malik, S. Belongie, T. Leung and J. Shi. "Contour and Texture Analysis for Image Segmentation". IJCV 43(1),7-27,2001.
Using texture features for segmentation • The final texture feature is a texton histogram computed over image windows at some “local scale”. J. Malik, S. Belongie, T. Leung and J. Shi. "Contour and Texture Analysis for Image Segmentation". IJCV 43(1),7-27,2001.
Pitfall of texture features • Possible solution: check for “intervening contours” when computing connection weights. J. Malik, S. Belongie, T. Leung and J. Shi. "Contour and Texture Analysis for Image Segmentation". IJCV 43(1),7-27,2001.
Results: Berkeley Segmentation Engine http://www.cs.berkeley.edu/~fowlkes/BSE/