Download
1 / 3
30 likes | 36 Views
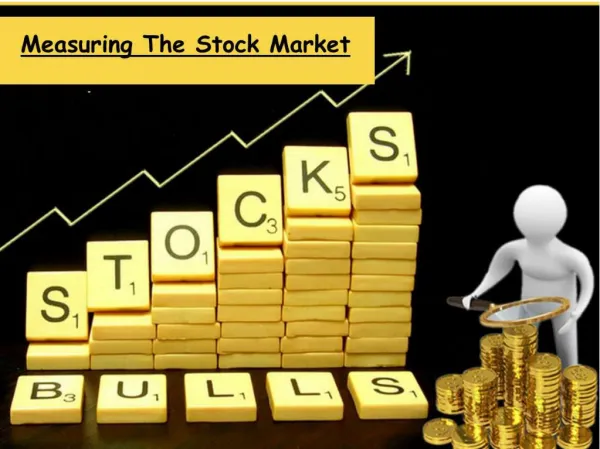
So how do you value the share price of stock for a given company? In other words, what is the intrinsic value of a given stock? Generally speaking, a stock is valued based on the company’s current financial state and what the market believes the company’s future financial state will look like. https://carnick.com/

E N D
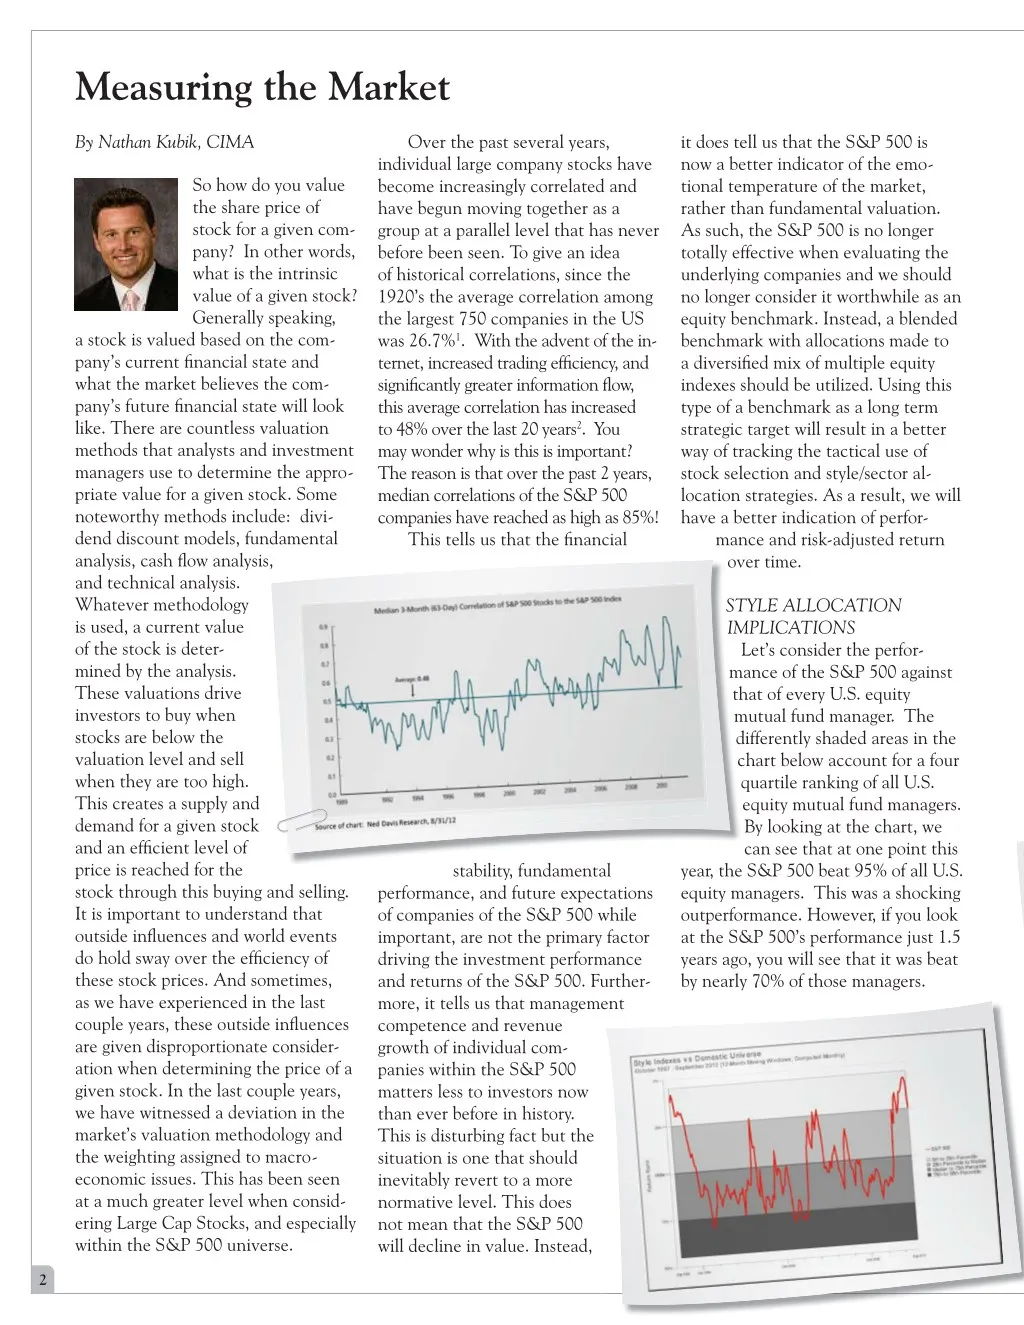
Measuring the Market By Nathan Kubik, CIMA individual large company stocks have become increasingly correlated and have begun moving together as a group at a parallel level that has never before been seen. To give an idea of historical correlations, since the 1920’s the average correlation among the largest 750 companies in the US was 26.7%1. With the advent of the in- ternet, increased trading efficiency, and significantly greater information flow, this average correlation has increased to 48% over the last 20 years2. You may wonder why is this is important? The reason is that over the past 2 years, median correlations of the S&P 500 companies have reached as high as 85%! This tells us that the financial Over the past several years, it does tell us that the S&P 500 is now a better indicator of the emo- tional temperature of the market, rather than fundamental valuation. As such, the S&P 500 is no longer totally effective when evaluating the underlying companies and we should no longer consider it worthwhile as an equity benchmark. Instead, a blended benchmark with allocations made to a diversified mix of multiple equity indexes should be utilized. Using this type of a benchmark as a long term strategic target will result in a better way of tracking the tactical use of stock selection and style/sector al- location strategies. As a result, we will have a better indication of perfor- mance and risk-adjusted return over time. ov So how do you value the share price of stock for a given com- pany? In other words, what is the intrinsic value of a given stock? Generally speaking, a stock is valued based on the com- pany’s current financial state and what the market believes the com- pany’s future financial state will look like. There are countless valuation methods that analysts and investment managers use to determine the appro- priate value for a given stock. Some noteworthy methods include: divi- dend discount models, fundamental analysis, cash flow analysis, and technical analysis. Whatever methodology is used, a current value of the stock is deter- mined by the analysis. These valuations drive investors to buy when stocks are below the valuation level and sell when they are too high. This creates a supply and demand for a given stock and an efficient level of price is reached for the stock through this buying and selling. It is important to understand that outside influences and world events do hold sway over the efficiency of these stock prices. And sometimes, as we have experienced in the last couple years, these outside influences are given disproportionate consider- ation when determining the price of a given stock. In the last couple years, we have witnessed a deviation in the market’s valuation methodology and the weighting assigned to macro- economic issues. This has been seen at a much greater level when consid- ering Large Cap Stocks, and especially within the S&P 500 universe. , STYLE ALLOCATION IMPLICATIONS Let’s consider the perfor- mance of the S&P 500 against that of every U.S. equity mutual fund manager. The differently shaded areas in the chart below account for a four quartile ranking of all U.S. equity mutual fund managers. By looking at the chart, we can see that at one point this year, the S&P 500 beat 95% of all U.S. equity managers. This was a shocking outperformance. However, if you look at the S&P 500’s performance just 1.5 years ago, you will see that it was beat by nearly 70% of those managers. ST IM m th m d c stability, fundamental performance, and future expectations of companies of the S&P 500 while important, are not the primary factor driving the investment performance and returns of the S&P 500. Further- more, it tells us that management competence and revenue growth of individual com- panies within the S&P 500 matters less to investors now than ever before in history. This is disturbing fact but the situation is one that should inevitably revert to a more normative level. This does not mean that the S&P 500 will decline in value. Instead, b l f d l h ent 2
The important take-away here is that various style and market cap strate- gies go in and out of favor, and that chasing the current hot performing index or style can be devastating to a portfolio over the long term. When looking at investing in U.S. equities, there are four primary domestic equity styles. These include Large Cap Growth (Amazon), Large Cap Value (Conoco Phillips), Small Cap Growth (Sam Adams), and Small Cap Value (Starwood). The idea of only utilizing the S&P 500 does not allow for shifting between the growth and value styles as they go in and out of favor. The S&P 500 also has no mid, small or international exposure. Those styles too go in and out of favor. In order to il- lustrate the benefits of style allocation over time, consider the following 30 year chart compar- ing the excess return of the Large Cap Value Index (Blue line) to that of Large Cap Growth Index (Yellow line) over that of the combined large cap stock market3. last month (September, 2012), and we will pay close attention to determine if this is a new trend. This same type of style allocation and analysis can be applied to large cap versus small cap companies. Consider the following graph where Large Cap stocks are de- picted in red and small cap in green3: the chart, over shorter term periods it can also significantly underperform3. Because of this volatility, it is impor- tant to allocate appropriately to limit exposure to that volatility. Through prudent diversification methods one can have exposure to these periods of outperformance while limiting the downside of those downturns. DIVERSIFICATION DISCUSSION The most important cornerstone of investing is diversification. Sim- ply put, diversification reduces portfolio volatil- ity. When talking about equities, having exposure to multiple styles and sectors can reduce down- side risk while capturing market like returns over the long term. While a diversified portfolio will always lag the hottest performing sec- tor, style, or index, it will provide the optimal structure for avoiding those devastating downturns. Using diver- sification will also avoid chasing the hot stock or index of the day which usually becomes overvalued and takes a loss tomorrow. It is important to understand that downside protection can have just as large an impact on actual portfolio value as that of upside capture. Remember that losing 50% CONTINUEDONNEXTPAGE? D c is p re ity eq to se sid m th di While large cap has obviously been in favor for the last 1.5 years, it is also clear that choosing to be allocated to small cap in those periods of outperformance can add a lot of extra return. There are benefits to having diversified expo- sure to both styles over the long run. Because small cap stocks have more volatility, they must be rewarded with a higher expected rate of return. As such, having some exposure to small cap stocks will lead to higher returns over a longer period of time. This be- comes clear when looking at the growth of a dollar in each of those strategies over the past 10 years. Over this 10 year period, Small Cap clearly outperforms, but as seen in Whil l su lon sto th a re e s h a in By overweighting the B i h i h i growth or value style that is in favor can add to performance over time. It is interesting to note that the value style has come back into favor this
“Thoughts on the Election” CONTINUEDFROMPAGE1 economy needs has been irrevocably altered. These are fundamental changes affect our economy and our financial lives, ones that can- not be undone with new legislation or a different outlook from the White House. Consider the three most plausible outcomes on November 6th: 1) President Obama is re- elected and the Senate remains in Democratic hands; 2) President Obama gets re-elected, but the Republicans gain control of the Senate; or 3) Romney is elected and the Republicans take the Senate on his coattails. None of those offers prospects for sweeping change; certainly, none of them can alter the underlying changes that have transformed our economy in the past decade. Even ObamaCare looks like it’s here to stay in some form or another, unless Romney is elected president alongside a supermajority of 60 Republican senators. The election provides an excuse to squabble over social issues more than an opportunity to solve our financial concerns, especially unem- ployment. That’s not to say we’re still in a mess of trouble, though. American companies may not be hiring many workers, but they are making profits at near-record levels, and that prosperity is reflected in stock prices that remain at lofty highs. We’re a long way from 2008, when it looked as if the entire financial sector might col- lapse upon itself. It’s a time to be prudent, and patient, but no longer a time to be afraid. In the end, perhaps the words of Caroline Ken- nedy make the most sense: “As much as we need a prosperous economy, we also need a prosperity of kindness and decency.” ? ?2) At the same time, personal debt has skyrock- eted. Average household debt is now at $7800, more than ten times what it was back in 1980, when it was just $670 per household. What appeared to be a period of rising fortunes was financed on the back of massive increases in personal debt. But the taste for personal debt has changed in America since the recession – household debt is now at its lowest point since 2006. People are spending less now and will continue to spend less in the future. We used to bemoan the low savings rate and now, deposits in Colorado Springs area banks are increas- ing at the fastest rate in 14 years. There’s a danger in building an economy on credit cards, but there’s also danger when people stop spending their money. With an economy in which consumer spending ac- counts for 70 percent of all activity, the implications of this are enormous. ?3) In 1965, the American auto industry employed 600,000 workers, who made more than 10 million poor-quality cars per year. Today, that same industry employs about 200,000 workers, but they’re now making about 8 million world-class cars. Today, I deposited a check to my bank account by taking a picture of the document with my smart phone. Yesterday, I purchased an e-book from Amazon and downloaded it to my tablet reader without ever involving another human being. America’s need for worker bees has changed. Before the housing collapse, the fast-rising homebuilding market helped conceal this fact, but the nature of what kind of workers our Be financially confident.® “Measuring” CONTINUEDFROMPAGE3 in a downturn will require a 100% return to simply make up that loss. Thus, limiting any loss during a downturn will make the subsequent up- turn mean that much more to the total value and total return of your investments. At Carnick & Kubik we focus significant efforts on minimizing downside risk exposure. We utilize appropriate diversification methodology to maximize risk adjusted return for our clients while smoothing the level of returns as much as possible. From a long term, strategic, allocation perspec- tive we seek to have exposure to all four of the domestic styles, as well as all sectors (Technology, Discretionary, Industrials, Health Care, etc.) Additionally, we will utilize some international ex- posure as appropriate, though we have had very little focus here as of late because of the macro-economic issues going on in Europe. From a tacti- cal, shorter term, standpoint, we overweight sectors and styles we feel to be in favor and underweight those we expect to lag. Underlying this diversification methodology is a sophisticated valuation methodology focusing on identifying the strongest of individual companies for se- lection in our portfolios. This article has focused primarily on the style allocation, which is just one of the many pieces in developing a diversified portfolio. Please reach out to us if you would like some more information on sector, valuation, or any other piece of the investment process. ? 675 Southpointe Court Colorado Springs, CO 80906 (719) 579-8000 5251 DTC Parkway Suite 1020 Greenwood Village, CO 80111 (303)741-2560 1 A Guide to the Markets: June 30, 2012,@ JP Morgan Asset Management. 2 Ned Davis Research, 8/31/12 3 Russell 1000 used for Large Cap Indexes, Russell 2000 used for Small Cap Indexes, and Russell 3000 used for Entire US Equity Index (800) 447-8181 www.Carnick.com