Download
1 / 15
150 likes | 234 Views
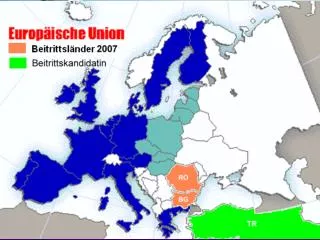
5.2 Low-energy strategies for the European Union. Katharina Koch Manuela Steiner Barbara Unterrainer. Present energy situation and structure. Energy Consumption. Figure 1: EU-27 final energy consumption of 2007, Breakdown by sector

E N D
5.2 Low-energy strategies for the European Union Katharina Koch Manuela Steiner Barbara Unterrainer
EnergyConsumption Figure 1: EU-27 final energy consumption of 2007, Breakdown by sector Source: European Union (2009): Enery, transport and environment indicators, S. 41. • 2007 the total final energy consists of the EU-27 amounts to 1158 Mtoe, this is an increase of 5 % compared to 1997
EnergyIndustry Figure 2: Power station generation, by type 2007 Source: European Union (2009): Enery, transport and environment indicators, S. 53. • In the year 2007 the total electricity generation within the EU 27 accounts for 3337 Twh, compared to the year 1997 this is an increase of 18 % • The greatest share of the EU-27 total RES Electricity generates Germany with 34 % , followed by Spain with 15 % • France and Spain generated 62 % of the EU-27 total nuclear electricity
Energy efficiency • Thermal efficiency 2007 • EU-27 power plants thermal efficiency was 47 % • Lithuania: highest thermal efficiency; 87,5 % • Malta: lowest thermal efficiency; 29,8 % • Combined heat and power generation 2007 • EU-27 gross electricity generated by CHP plants accounted to 10,9 % • Large differences between the member states • Denmark: highest share with 42,8 % • Cyprus: lowest share with 0,3 % Source: European Union (2009): Enery, transport and environment indicators, S. 54-57.
EU’s objectives on climate change and renewable energy for 2020
20-20-20 Target 20% reduction of greenhouse gases by 2020 compared to 1990 levels and an objective for a 30% reduction by 2020 subject to the conclusion of a comprehensive international climate change agreement. Reducing energy consumption by 20% through increased energy efficiency. A mandatory EU target of 20% renewable energy by 2020 including a 10% biofuels target.
EU-Emission Trading Scheme (ETS) 2013 EU wide ETS Cap Non ETS-sectors reduction of 14% compared to 2005 ETS-Sectors reduction of 21% compared to 2005 Major Change: EU-wide cap instead of national caps Allocation Auctioning Power sector 100% auctioning. „Normal sectors“ free allocation 80% 2013 and 30% 2020. „Exposed sectors“ with potential carbon leakage up to 100% free allocation. Exclusion of small installations If emits less than 25 000 t of CO2e per year
Energy efficiency & renewable energy actions Sustainable Energy Europe Campaign contributes achieving the EU’s energy policy targets within the fields of renewable energy sources, energy efficiency, clean transport and alternative fuels. A major tool to promote the EU’s sustainable energy policy. Stimulate the necessary trends towards an increase in private investment in sustainable energy technologies.
Energy efficiency & renewable energy actions Convenant of Mayors A commitment by signatory towns and cities to go beyond the objectives of EU energy policy in terms of reduction in CO2 emissions. Own unique Sustainable Energy Action Plan (SEAP). Action Plans will be continually monitored by the European Commission. Since 2008 more than 500 cities have joined the Convenant. 80 million citizens across Europe are now part of the initiative.
Energyselfsufficiency • Zero-energyhouses • Standard in thewayofbuilding all overeurope • Decentralizationoftheenergysupply • Every region in Europe hastogeneratetheamountofenergythatisneedsbyitself – depending on itsownresourcesandadvantagesoftheregion (photovoltaicand solar panels, wind mills, hydro-power, geothermicsetc)
Mobility • Minimizefuturetransportneedsandcardependency • Improvepublictransportsystem in cities • More cycleways • Increasecar-pooling • Egthecityof Malmö in Sweden • Fullyelectricvehicles • All vehicles (private, publictransportetc) shouldbebased on this „new“ technology
Mobility • Transport of goods • To minimize transport needs of goods it is necessary to grow and produce goods locally • Pneumatic tube • Post sytem that delivers goods to consumers per tube • This system could also be used for waste
Video • This video is about the isle Samso in Denmark which is CO2 neutral because it generates all the energy needed by itself. ENJOY! • http://www.youtube.com/watch?v=FmJxUsXWajo&feature=related