Download
1 / 1
10 likes | 131 Views
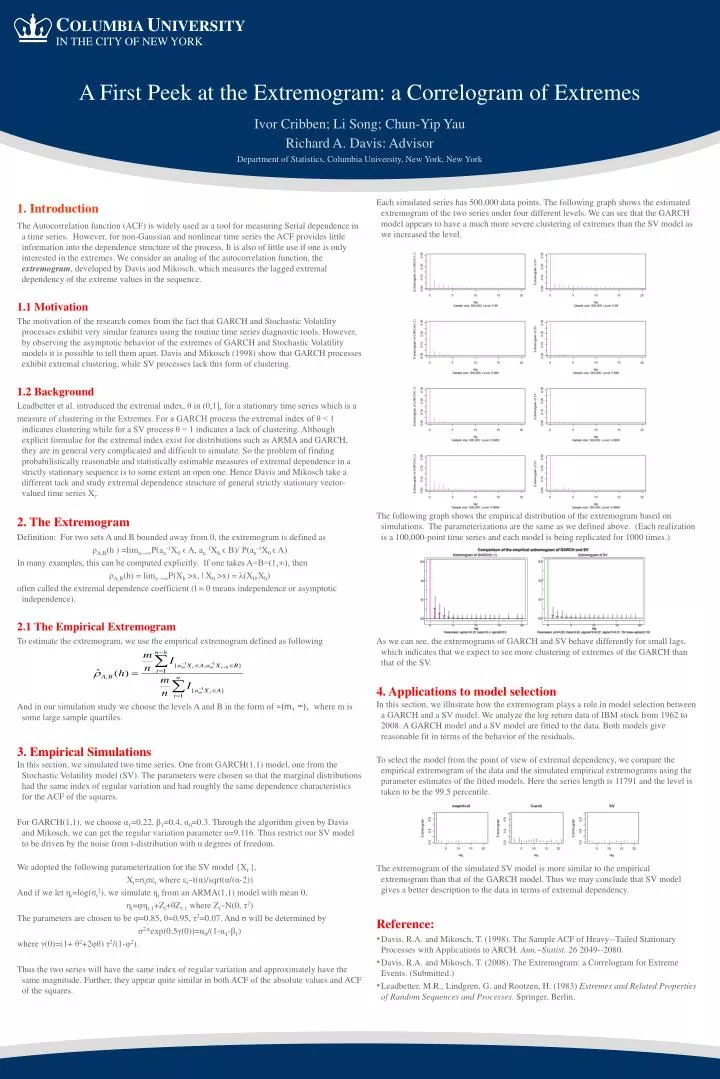
C OLUMBIA U NIVERSITY IN THE CITY OF NEW YORK. A First Peek at the Extremogram: a Correlogram of Extremes. Ivor Cribben; Li Song; Chun-Yip Yau Richard A. Davis: Advisor Department of Statistics, Columbia University, New York, New York. 1. Introduction

E N D
COLUMBIA UNIVERSITY IN THE CITY OF NEW YORK A First Peek at the Extremogram: a Correlogram of Extremes Ivor Cribben; Li Song; Chun-Yip Yau Richard A. Davis: Advisor Department of Statistics, Columbia University, New York, New York 1. Introduction The Autocorrelation function (ACF) is widely used as a tool for measuring Serial dependence in a time series. However, for non-Gaussian and nonlinear time series the ACF provides little information into the dependence structure of the process. It is also of little use if one is only interested in the extremes. We consider an analog of the autocorrelation function, the extremogram, developed by Davis and Mikosch, which measures the lagged extremal dependency of the extreme values in the sequence. 1.1 Motivation The motivation of the research comes from the fact that GARCH and Stochastic Volatility processes exhibit very similar features using the routine time series diagnostic tools. However, by observing the asymptotic behavior of the extremes of GARCH and Stochastic Volatility models it is possible to tell them apart. Davis and Mikosch (1998) show that GARCH processes exhibit extremal clustering, while SV processes lack this form of clustering. 1.2 Background Leadbetter et al. introduced the extremal index, θ in (0,1], for a stationary time series which is a measure of clustering in the Extremes. For a GARCH process the extremal index of θ < 1 indicates clustering while for a SV process θ = 1 indicates a lack of clustering. Although explicit formulae for the extremal index exist for distributions such as ARMA and GARCH, they are in general very complicated and difficult to simulate. So the problem of finding probabilistically reasonable and statistically estimable measures of extremal dependence in a strictly stationary sequence is to some extent an open one. Hence Davis and Mikosch take a different tack and study extremal dependence structure of general strictly stationary vector-valued time series Xt. 2. The Extremogram Definition: For two sets A and B bounded away from 0, the extremogram is defined as ρA,B(h ) =limn→∞P(an-1X0 ϵ A, an-1Xh ϵ B)/ P(an-1X0 ϵ A) In many examples, this can be computed explicitly. If one takes A=B=(1,∞), then ρA,B(h) = limx→∞P(Xh >x, | X0 >x) = λ(X0,Xh) often called the extremal dependence coefficient (l = 0 means independence or asymptotic independence). 2.1 The Empirical Extremogram To estimate the extremogram, we use the empirical extremogram defined as following And in our simulation study we choose the levels A and B in the form of =(m, ∞), where m is some large sample quartiles. 3. Empirical Simulations In this section, we simulated two time series. One from GARCH(1,1) model, one from the Stochastic Volatility model (SV). The parameters were chosen so that the marginal distributions had the same index of regular variation and had roughly the same dependence characteristics for the ACF of the squares. For GARCH(1,1), we choose α1=0.22, β1=0.4, α0=0.3. Through the algorithm given by Davis and Mikosch, we can get the regular variation parameter α=9.116. Thus restrict our SV model to be driven by the noise from t-distribution with α degrees of freedom. We adopted the following parameterization for the SV model {Xt }, Xt=σtσεtwhere εt~t(α)/sqrt(α/(α-2)) And if we let ηt=log(σt2), we simulate ηt from an ARMA(1,1) model with mean 0, ηt=φηt-1+Zt+θZt-1 where Zt~N(0, τ2) The parameters are chosen to be φ=0.85, θ=0.95, τ2=0.07. And σ will be determined by σ2*exp(0.5γ(0))=α0/(1-α1-β1) where γ(0)=(1+ θ2+2φθ) τ2/(1-φ2). Thus the two series will have the same index of regular variation and approximately have the same magnitude. Further, they appear quite similar in both ACF of the absolute values and ACF of the squares. • Each simulated series has 500,000 data points. The following graph shows the estimated extremogram of the two series under four different levels. We can see that the GARCH model appears to have a much more severe clustering of extremes than the SV model as we increased the level. • The following graph shows the empirical distribution of the extremogram based on simulations. The parameterizations are the same as we defined above. (Each realization is a 100,000-point time series and each model is being replicated for 1000 times.) • As we can see, the extremograms of GARCH and SV behave differently for small lags, which indicates that we expect to see more clustering of extremes of the GARCH than that of the SV. • 4. Applications to model selection • In this section, we illustrate how the extremogram plays a role in model selection between a GARCH and a SV model. We analyze the log return data of IBM stock from 1962 to 2008. A GARCH model and a SV model are fitted to the data. Both models give reasonable fit in terms of the behavior of the residuals. • To select the model from the point of view of extremal dependency, we compare the empirical extremogram of the data and the simulated empirical extremograms using the parameter estimates of the fitted models. Here the series length is 11791 and the level is taken to be the 99.5 percentile. • The extremogram of the simulated SV model is more similar to the empirical extremogram than that of the GARCH model. Thus we may conclude that SV model gives a better description to the data in terms of extremal dependency. • Reference: • Davis, R.A. and Mikosch, T. (1998). The Sample ACF of Heavy--Tailed Stationary Processes with Applications to ARCH. Ann.~Statist. 26 2049--2080. • Davis, R.A. and Mikosch, T. (2008). The Extremogram: a Correlogram for Extreme Events. (Submitted.) • Leadbetter, M.R., Lindgren, G. and Rootzen, H. (1983) Extremes and Related Properties of Random Sequences and Processes. Springer, Berlin.