Download
1 / 49
520 likes | 925 Views
2006 DHS Bioterrorism Risk Assessment: Methodology. Richard S. Denning, Ph.D. Committee on Methodological Improvement to the Department of Homeland Security’s 2006 Bioterrorism Risk Assessment 28 August 2006. Presentation Objectives.

E N D
2006 DHS Bioterrorism Risk Assessment: Methodology Richard S. Denning, Ph.D. Committee on Methodological Improvement to the Department of Homeland Security’s 2006 Bioterrorism Risk Assessment 28 August 2006
Presentation Objectives • Provide overview of approach taken to the Quantitative Risk Assessment performed for the 2006 Assessment • Because of the sensitivity of the topic and the availability to the general public, this presentation includes no quantitative results • The translation of an event-tree based approach from nuclear power plant accident risk to biological terrorism risk is in general straightforward • We will identify elements of the approach where important choices were made (where alternatives exist) • There are some areas where we plan to make significant changes • Manner in which subject matter experts are used • Expanded economic modeling • Will be discussed in presentation tomorrow.
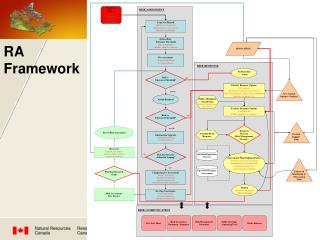
Dissemination Efficiency Agent Release Modeling Agent Mass Mitigation Response Disease Spread RISK Threat Group Target Agent Production AGENT RELEASE Dispersion Mitigation Scenario Consequences Bioagent Scenario Probability Agent Risk Ranking Selection Probability Selection Probability Selection Probability Event Detection Initiation Frequency Event Tree Quantification Scenario Analysis and Consequence Modeling
Probabilistic Risk Assessment (PRA) - Fundamentals • “Risk is the potential for some unwanted event to occur. Risk is a function of the likelihood of the event and its consequences.” (National Infrastructure Protection Center, 2002). • The term PRA is applied to a method of assessing accident risk for nuclear power plants (WASH-1400, 1973-1975) • Now also widely used for chemical and aerospace risk • Of particular value for low frequency, high potential consequence events in which there is not a sufficient data base to assess risk using conventional statistics
Probabilistic Risk Assessment (PRA) - Fundamentals • PRA divides the spectrum of possible events into a discrete set of scenarios. For each scenario, si • Estimate consequence, Ci • Estimate probability, pi • Aggregate the risk from the set of all triplets <pi,si,Ci> • The PRA approach is often referred to as triplet analysis or scenario analysis. • In contrast to the more qualitative, attribute-based risk assessment approaches.
2006 Risk Assessment Scope • Assess the risk in the U.S. from bioterrorism • Twenty-eight bioagents • Fatality, illness, and direct economic impact • Characterize the uncertainty in risk results • Time frame – Conditions as they would be expected to exist in the period 1 January 2006 to 31 December 2010 • Risk is averaged over the time period of one year • Threat organizations are represented by generic categories • Targets are represented by generic categories of targets – but analysis of scenarios performed at as low a level as possible (for surrogate targets) • Risk is regionally averaged over the U.S.
Event-Tree Based Method • The event-tree based method is a direct extension of PRA as used in nuclear power plants • But no role for fault tree analysis as used for nuclear power plant accident risk • An event-tree (decision tree) is a visual tool that is used to represent multiple outcomes of consecutive events • In the following simple example, the event tree has two branches per event …
Comparison with Example Tree • The event tree used in the study has 17 events • Each event has multiple branches, rather than two • The tree is much too big to be drawn • Each branch probability (split fraction) is represented by a distribution, rather than a single probability • These distributions represent uncertainty in knowledge of terrorist capabilities and their likely actions • Each pathway through the tree is a “scenario” • The scenario probabilities are represented by high dimensional joint distributions, rather than a single set of values • Latin hypercube sampling, a stratified Monte Carlo technique, is used to construct a sample (500) from the joint distribution • For a single agent (B. anthracis, the causative agent of anthrax), the complete event tree results in more than 35 million scenarios
Event Tree Branches and Dependencies – Target and Bioagent Selection
Event Tree Branches – Selection of Dissemination Mode
Event Tree Branches – Production and Processing
Quantification of Branch Probabilities • Branch probabilities were assessed as multi-way splits • These were transformed into binary splits • Uncertainty was expressed as a variance • Beta functions were used to represent the distributions
Event Tree Quantification • Examples • Definition of Terrorist Organization Categories • Quantification of Initiating Events • Selection of Targets • Selection of Bioagents • Selection of Mode of Acquisition • Input to Quantification • Battelle staff • Biological Threat Intelligence Support Working Group – DHS, NCTC co-chair
Definition and Characterization of Threat Organizations • Definition of four categories of threat organizations • International Terrorist Group • State Supported Group • Domestic Group (e.g. Paramilitary) • Individual or Small Group • Technical capabilities • Financial resources • Motivations • Inflict maximal consequences to U.S. public • Attack specific individuals or groups • Produce economic loss or illnesses but not fatalities • Attack symbolic targets – Religious, Political, Governmental, American
Initiating Event Frequency • Initiating frequencies for categories based on international historical data plus Intelligence input – log normal distributions • Initiating frequency refers to an action taken to begin the process leading to the release of bioagent
Targets/Surrogates - Inhalation • Large Open Building • Shopping Mall • Entertainment/Political/Religious • Transportation Terminal • Small Enclosure • Transportation Unit • Large Divided Building • Cruise Ship • Public/Private Building • Large Outdoor Spaces • Urban Center • Urban Event • Stadium
Targets/Surrogates - Other Pathways • Water • Public water supply • Food • Milk • Packaged food • Produce • Vectors • Contagious person(s) • Contact • Letter
Targets/Attributes - Inhalation • Large Open Building • Potential for large consequences • Includes religious targets • Includes political targets • Small Enclosure • Potential for modest consequences • Relatively little agent required • Low cost • Large Divided Building • Potential for modest to large consequences • Includes political targets • Large Outdoor Spaces • Potential for very high consequences • Includes some political targets • Symbolically U.S. targets
Targets/Attributes - Other Pathways • Water • Potential for high consequences • Food • Potential for moderate consequences • Low cost • Potential for non-lethal or economic consequences • Human Vectors • Potential for very high consequences • Surface Contact • Low number of consequences • Affects targeted individuals or groups
Probability of Target Selection • Relative probabilities based on comparison of Terrorist Organization motivations and Target attributes
Bioagent Selection • Which comes first target selection or bioagent selection? • Either is possible • 2006 Assessment analyses assume that target comes first but targets and bioagents are closely correlated • For 2008 Assessment we plan to elicit both ways and combine results • Inconceivable combinations of targets and bioagents were eliminated a priori • Poor choices were allowed to be selected but resulted in small or no consequences
Bioagent Selection (Cont) • Biological Threat Intelligence Support Working Group made a coarse ranking of relative probabilities of bioagent selection (primarily based on “familiarity”) • DHS did a more detailed assessment based on ease of acquisition, lethality, and stability Agent Selection Probability = SME0.6 X Agent Characteristics0.4
Mode of Dissemination • Branching is only required for inhalation exposures • Dissemination modes are combinations of • Release height – ground-level or aerial • Stationary or mobile release • Dry form of bioagent – explosive or blower • Wet form of bioagent - fogger, sprayer or explosive
Mode of Dissemination • Assessments made by Battelle staff based on terrorist organization capabilities, bioagent characteristics, and targets
Mode of Agent Acquisition • Perception of ease of acquisition was a consideration in assessing the selection probabilities of different bioagents • This event addresses the mode by which the bioterrorism organization will obtain the bioagent • Branch probability assessments were made by Battelle staff but with input from the Biological Threat Support Working Group
Scope of Consequence Analysis • Intent of the analysis is to be as realistic as practical • Three measures of consequence assessed – # of fatalities, # of illnesses, direct economic health-related cost • Sources of variability are identified and characterized by distributions • Population density of cities • Numbers of shoppers in shopping malls • Attendees at sporting events • For all pathways, exposure equations are expressed in the same form as products of distributions • Monte Carlo analysis is used to combine the consequences of distributions • Epistemic uncertainty in consequence was examined through sensitivity analysis
Basic Consequence Equations • MT = target mass • Tradeoff - maximize production but minimize risk of being discovered • MT distribution based on range of production time (one week to 8 weeks) • MR = MT * QF1 * QF2 * QF3 * QF4 * QF5 • MR = mass release • QF1 = production quantity factor • QF2 = processing quantity factor • QF3 = drying factor • QF4 = storage factor • QF5 = transportation factor
Basic Consequence Equations (Cont) • MRE = MR * QFA * QFR * QADD • MRE = effective mass release • QFA = active fraction after dissemination (inhalation modes) • QFR = respirable fraction after dissemination (inhalation modes) • QADD = additive factor
Basic Consequence Equations (Cont) • CI = RI|MRE * MEI|RI • CI = number of illnesses • RI|MRE = illnesses given effective mass release • MEI|RI = epidemiological illness factorgiven the number of ill • CF = CI * RF|MRE * MFI • CF = number of fatalities • RF|MRE = deaths per illness given effective mass release • MFI = medical mitigation/epidemiological factor
Consequence – Scenario Relations • Unique component distributions are not required for each scenario • With over 35 million scenarios, this is not feasible. • Each component is specified to depend on a subset of tree events • For example, mass produced depends on Terrorist Group and Production Method • Significant analysis and simulation is required for the development of component distributions • For example, a simulation, a response surface model, and a set of approximately 50 HPAC runs are required for outdoor release components
Consequence – Scenario Relations (Cont) • In spite of making each component depend only on necessary tree layers, combinatorics still come in to play when calculating consequences • Eleven of the 17 layers affect consequence distributions • For a single agent (B. anthracis), there are nearly 140,000 unique consequence distributions • For illness, fatality and economics • Each distribution is represented with a sample of 1,000 values but converted to a histogram for risk calculations • Requires mixing distributions using scenario probabilities
Characterizing Risk • Risk described as the probability of events times their consequences does not differentiate between events with high consequences and low frequencies and those with low consequences and high frequencies • Events that result in 3,000 deaths every three years and those with 3 deaths per event that occur once per day both have a risk of 1x10³ deaths per year • But the public perception of these two different types of event is substantially different • The risk manager needs a tool that measures the dependence of event frequency on consequence level
The Risk Curve • In PRA, a more general definition of risk is used that provides a measure of frequency of events as a function of consequences. • The complementary cumulative distribution function is the form typically used • For a specific value of consequence (C*) on the x-axis, the curve describes the frequency of bioterror acts that result in C* or larger consequences.
Treatment of Uncertainty • If policy decisions are to be based on the results of risk analyses, they must be made with full understanding of the associated uncertainties • Uncertainty analysis is integral to the PRA approach • Two types of uncertainty are considered • Aleatory (variability) • Epistemic (state of knowledge) • Distributions are developed for each of the inputs to the analysis • Monte Carlo analysis is used to develop a sample from each distribution • The process results in a family of risk curves
Risk Displays • 5th percentile, median, mean and 95th percentile curves are more easily interpreted than the superposition of 500 curves • Nevertheless, the preferred form of display by decision-makers is the consequence-weighted density function • Although the variation with consequence magnitude is not explicitly presented, the uncertainty is displayed
Ranking the Risk of Bioagents • The principal product of the 2006 Assessment was the ranking of the risk of bioagents
Uses of QRA Results • QRA is a tool used by the risk manager • Risk prioritization • Comparison of the effectiveness of alternative risk management strategies • Risk-based cost-benefit analysis • Regulation
Advantages of QRA • Ease of risk decomposition • Risk results can be examined from different perspectives • The 2006 Assessment shows • Risk as a function of bioagent • Risk as a function of target • Risk as a function of terrorist organization • Risk for scenarios with consequences greater than different threshold levels • Ability to perform sensitivity studies • Sensitivity studies were performed to show the impact of analysis assumptions on the risk results • Sensitivity studies were performed to show the significance of uncertainties in bioagent properties • Transparency • The reasons for results can be identified and challenged
Key Elements of Approach Used in 2006 Assessment • Use of event tree/scenario-based analysis versus alternatives • Use of goal production quantity with quantity/quality factor modifiers • Concept of activity initiation leading to an event or multiple events • Emphasis on expectation value of probability density functions • Use of attribute-based logic models to assess branching probabilities • Normalization of results to total risk • Treatment of scenario surrogates as a sublevel under the eight major categories of targets (to be changed) • Treatment of uncertainty including the separation of uncertainties into aleatory and epistemic components