Download
1 / 59
620 likes | 1.29k Views
Chapter 2 Demand and Supply Analysis. Outline. 1. Competitive Markets Defined 2. The Market Demand Curve 3. The Market Supply Curve 4. Equilibrium 5. Characterizing Demand and Supply: Elasticity 6. Back of the Envelope Techniques. Example: Oil Market. Why?

E N D
Outline 1. Competitive Markets Defined 2. The Market Demand Curve 3. The Market Supply Curve 4. Equilibrium 5. Characterizing Demand and Supply: Elasticity 6. Back of the Envelope Techniques
Example: Oil Market Why? • Weather, Hurricanes in Gulf • China and India economies booming • Political Crisis with Iran, Iraq, Russia, Nigeria • Oil production per day in Non-OPEC countries declining • Uncertainty over OPEC production capabilities • Crude oil prices 1947 – 2004 • OPEC oil production • Some experts predict that prices will rise to 100
Example: Oil Market (cont’d) How could we bring prices down? • Reduce Demand – short-run • Find new reserves – short-run • Develop new technologies that are not reliant on oil • Forward thinking solution • These become feasible as oil prices rise. Many are now feasible
Competitive Markets Definition: Are those with sellers and buyers that are small and numerous enough that they take the market price as given when they decide how much to buy and sell.
Competitive Market Assumptions • Fragmented market: many buyers and sellers • Implies buyers and sellers are price takers • Undifferentiated Products: consumers perceive the product to be identical so don’t care who they buy it from • Perfect Information about price: consumers know the price of all sellers • Equal Access to Resources: everyone has access to the same technology and inputs. • Free entry into the market, so if profitable for new firms to enter into the market they will
The Market Demand Function tells us how the quantity of a good demanded by the sum of all consumers in the market depends on various factors. Qd = (Q,p,po, I,…) The Demand Curve Plots the aggregate quantity of a good that consumers are willing to buy at different prices, holding constant other demand drivers such as prices of other goods, consumer income, quality. Q(p) Qd=
The Demand for New Automobiles in the United States Price (thousands of dollars) 53 40 Demand curve for automobiles in the United States in 2000 0 2 5.3 Quantity (millions of automobiles per year)
Note: We always graph P on vertical axis and Q on horizontal axis, but we write demand as Q as a function of P… If P is written as function of Q, it is called the inverse demand. Normal Form: Qd= 100-2P Inverse form: P = • 50 - Qd/2 • Markets defined by commodity, geography, time.
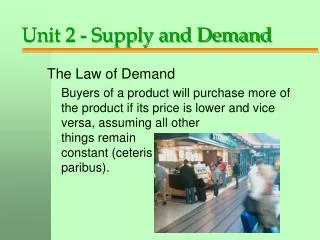
Law of Demand Law of Demand states that the quantity of a good demanded decreases when the price of this good increases. • Empirical regularity The demand curve:shifts when factors other than own price change… • If the change increases the willingness of consumers to acquire the good, the demand curve shifts right • If the change decreases the willingness of consumers to acquire the good, the demand curve shifts left
Some Demand Shifters • Consumer incomes • Consumer tastes • Advertising What would a rise in tax rate do? Note: For a given demand curve we assume everything else but price is held fixed.
Rule A move along the demand curve for a good can only be triggered by a change in the price of that good. Any change in another factor that affects the consumers’ willingness to pay for the good results in a shift in the demand curve for the good.
The Market Supply Function: tells us how the quantity of a good supplied by the sum of all producers in the market depends on various factors Qs= Q(p,po,w, …) Po = price of other goods The Market Supply Curve: Plots the aggregate quantity of a good that will be offered for sale at different prices. Qs= Q(P)
Price (dollars per bushel) Supply curve for wheat in Canada in 2000 0 0.15 Quantity (billions of bushels per year) Example: Supply Curve for Wheat in Canada
Definition: The Law of Supply states that the quantity of a good offered increases when the price of this good increases. • Empirical regularity • The supply curve shifts when factors other than own price change… • If the change increases the willingness of producers to offer the good at the same price, the supply curve shifts right • If the change decreases the willingness of producers to offer the good at the same price, the supply curve shifts left
Supply Shifters • Price of factors of production e.g. wage • Technology changes • Weather conditions • Hurricane Katrina reduced supply of oil • Number of producers change What is the effect of a rise in the minimum wage?
Rule A move along the supply curve for a good can only be triggered by a change in the price of that good. Any change in another factor that affects the producers’ willingness to offer for the good results in a shift in the supply curve for the good.
Example: Canadian Wheat • QS = p + .05r • QS = quantity of wheat (billions of bushels) • p = price of wheat (dollars per bushel) • r = average rainfall in western Canada, • May – August (inches per month)
QS = p + .05r • a. Quantity of wheat supplied at price of $2 and rainfall of 3 inches per month = 2.15 • b. Supply curve when rainfall is 3 inches per month: • QS = p + 0.15 • c. Law of supply holds: we know because the constant in front of p is positive • d. As rainfall increases, supply curve shifts right (e.g., r = 4 => Q = p + 0.2)
QS = p + .05r Price ($) r = 0 Supply with no rain 0 Quantity, Billion bushels
Price ($) r = 0 r = 3 Supply with no rain Supply with 3” rain 0 .15 Quantity, Billion bushels QS = p + .05r
Market Equilibrium Definition: A market equilibrium is a price such that, at this price, the quantities demanded and supplied are the same. (Demand and supply curves intersect at equilibrium)
Example: Finding Equilibrium Price and Quantity The Market for Cranberries Qd = 500 – 4p QS = -100 + 2p p = price of cranberries (dollars per barrel) Q = demand or supply in millions of barrels per year
Qd = 500 – 4p • Qs = -100 + 2p • a. The equilibrium price of cranberries is calculated by equating demand to supply: Qd = Qs … or… 500 – 4p = -100 + 2p …solving, P* = $100 • plug equilibrium price into either demand or supply to get equilibrium quantity: • Q* =100
Example: The Market For Cranberries Price Price 125 Market Supply: P = 50 + QS/2 Market Supply: P = 50 + QS/2 P* = 100 Equilibrium 50 Market Demand: P = 125 - Qd/4 Quantity Quantity Q* = 100
Elasticity • Definition: The own price elasticity of demand is the percentage change in quantity demanded brought about by a one-percent change in the price of the good.
Elasticity is not the slope • Slope is the ratio of absolute changes in quantity and price. (= Q/P). • Elasticity is the ratio of relative (or percentage) changes in quantity and price. • Why elasticity is more useful? • it is unitless so allows us to easily compare across countries and goods • Units of quantities will be different for different goods. How to compare snow boards to oranges. • Prices are different across different countries. More difficult to compare Yemeni Ryials to US $
When reading these remember the denominator is 1. • Price Elasticity of Demand for Selected Grocery Products, Chicago, 1990s
Elasticity Continued • The price elasticity of demand for records is -2. Tell me in words what this means. • A 1 percent increase in price of records will lead to a 2 percent decrease in quantity of records demanded.
Types of Elasticity • When a one percent change in price leads to a greater than one-percent change in quantity demanded, the demand curve is elastic. (Q,P < -1) • When a one-percent change in price leads to a less than one-percent change in quantity demanded, the demand curve is inelastic. (0 >Q,P > -1) • When a one-percent change in price leads to an exactly one-percent change in quantity demanded, the demand curve is unit elastic. (Q,P = -1)
Example: Linear Demand Curve • Qd = a – bp • a, b are positive constants • p is price • b is the slope • a/b is the choke price Choke price: price at which quantity demanded is zero
the elasticity is • Q,P = (Q/p)(p/Q) …definition… • =-b(p/Q) • When Q=0, elasticity is - • When p=0, elasticity is 0 • so…elasticity falls from 0 to - along the linear demand curve, but slope is constant.
Example: Elasticity with a Linear Demand Curve P Q,P = - a/b Elastic region • Q,P = -1 a/2b Inelastic region Q,P = 0 Q a 0 a/2
Example: Determining Elasticity if Qd = 400 – 10p, and p = 30, Q,P = (-b)(P)/(Q) Q = 400 – 10 (30) = 100 Q,P = (-10)(30)/(100) = -3 "elastic" Why is elasticity negative – demand curve downward sloping.
Example: Constant Elasticity Demand Curve • Qd = Ap • = elasticity of demand and is • negative • p = price • A = constant • Example:If demand can be expressed as QP = 100, what is the price elasticity of demand? This is how the demand function looks in general Q=100P-1 , so elasticity is -1
Price • Observed price and quantity P Constant elasticity demand curve Linear demand curve 0 Q Quantity Example: A Constant Elasticity versus a Linear Demand Curve
Elasticity Continued Price Elasticity of Demand is very useful. • Suppose own a car business total revenue is: price * quantity= P.Q • You can increase the price (P), but if you do that demand (Q) for your good will drop • The price elasticity of demand tell you how much the quantity will drop.
How Elastic are these Curves? D2 Perfectly Inelastic P P1 D1 Perfectly Elastic Q2 Q
What Affects Elasticity? • Availability of Substitutes: • Demand is more(less) elastic when there are more(fewer) substitutes for a product. • % of income spending on product • Demand is more(less) when the consumer’s expenditure on the product is large(small) • Necessity Products • The demand is less price elastic when the product is a necessity. • Market Level vs Brand-Level Price • Demand tends to be more elastic for a particular brand of a good, than for the good in general
Elasticity Continued • Elasticity varies with (among other factors): • Substitutability • Example: Demand for all beverages less elastic than demand for Coca-Cola • There are substitute for Coca-Cola, drink Pepsi • It is harder to find a substitute for soda if you love soda.
Importance of Brands • Demand for individual models is highly elastic • Market-level price elasticity of demand for automobiles -1 to -1.5 • Compact automobiles have lots of substitutes Luxury cars have less substitutes • Demand for compact cars more elastic than luxury cars. Example: Price Elasticities of Demand for Automobile Makes, 1990.
Definition: A durable good is a good that provides valuable services over a long time (usually many years). – airplane, car • Demand for non-durables (e.g. oil) less elastic in the short run when consumers can only partially adapt their behavior. Demand for durables more elastic in the short run because consumers can delay purchase. • Demand for Oil : short-run is less elastic (inelastic? ) • We own a car with a given mileage. • Takes time to move to smaller cars and solar panels
Example: Demand for Commercial Aircraft Price ($/airplane) Which demand curve is the short-term and which long-term? Quantity (aircraft/yr)
Example: Demand for Commercial Aircraft Price ($/airplane) Long run demand curve for commercial airplanes Short run demand curve for commercial airplanes Quantity (aircraft/yr)
Other Elasticities -- Elasticity of "X" with respect to "Y": (X/Y)(Y/X) • Price elasticity of supply (QS/p)(p/QS) …measures curvature of supply curve • Income elasticity of demand (Qd/I)(I/Qd) …measures degree of shift of demand curve as income changes… • Cross price elasticity of demand (Qd/Po)(Po/Qd)…measures degree of shift of demand curve when the price of a substitute changes
The Cross-Price Elasticity of Cars Price What is the cross price elasticity of demand of the Sentra with respect to Escort (0.454)? If the price of the Escort increases by 10 %, the demand for the Sentra will increase by 4.54 % Demand
Elasticities of Demand for Coke and Pepsi What is the income elasticity of demand of Coke? If income increases by 10%, the demand for coke will increase by 5.8%.
Back of the Envelope Calculations: Estimating Supply and Demand Functions • We can estimate Demand and Supply curves by: • Choose a general shape for functions (i.e. linear) • Q=a-bP ( could have chosen constant elasticity) • Knowing: • Own Price Elasticities • Equilibrium Price • Equilibrium Quantity • Usually we would want to collect data and estimate the model but this can be time consuming and costly
Back of the Envelope Calculations Example • Suppose demand is linear: Qd = a-bP • Hence, elasticity is Q,P = -bP/Q • If we have data on , Q and P, we can calculate b from elasticity equation and then calculate “a” by substituting into demand.