Download
1 / 50
510 likes | 846 Views
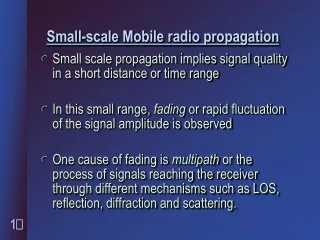
Small-scale Mobile radio propagation. Small scale propagation implies signal quality in a short distance or time range In this small range, fading or rapid fluctuation of the signal amplitude is observed

E N D
Small-scale Mobile radio propagation • Small scale propagation implies signal quality in a short distance or time range • In this small range, fading or rapid fluctuation of the signal amplitude is observed • One cause of fading is multipath or the process of signals reaching the receiver through different mechanisms such as LOS, reflection, diffration and scattering.
Multipath effects • Rapid changes in signal amplitude over a small distance or time interval. • Rapid changes in signal phaseover a small distance or time interval. • Time dispersion (echoes) caused by multipath propagation delay.
Causes of fading • In urban areas, fading occurs because the height of mobile is lesser than the height of surrounding structures, such as buildings and trees. • Existence of several propagation paths between transmitter and receiver.
Factors influencing small signal fading • Multipath propagations • Speed of mobile (Doppler shift) • Speed of surrounding objects • Bandwidths of signal and channel
Analysis of multipath channel Receiver Transmitter Spatial position d
Convolution model for multipath signal Received signal: y(t) = A0 x(t) + A1 x(t - t1) + A2 x(t - t2) + ... A2 x(t- t2) LOS T R, y(t) , x(t) A1 x(t- t1)
System definition of multipath h(t) x(t) y(t)
Baseband signal definition j2fct x(t) = Re { c(t) e } • Transmitted signal c(t)- pulse
Received signal and system response j2pfct y(t) = Re {r(t) e } j2p fct h(t) = Re {hb(t) e } • Received signal • Impulse response
Base band equivalent channel hb(t) c(t) r(t)
Modeling of the baseband multipath model r(t) = c(t) * hb(t, t) • Mathematicalmodel hb(t,t) t3 t2 t1 t0 tot1t2 tN-2 tN-1
Excess delay concept • The delay axis t, to<= t <= tn-1 is divided into equal time delay segments called excess delay bins. t0 = 0 t1 = t t2 = 2 t tN-1 = (N-1)t
Delay component design • All multipath signals received within the bins are represented by a single resolvable multipath component having delay ti. • Design equation for bin width t: Bandwidth of signal = 2/t
Final model for multipath response N-1 ji r(t) = ai e c[t –ti] i = 0 • c(t) – Transmitted pulse • r(t) – Received pulse • N – Number of multipaths • ai– Amplitude of multipath i • qi– Amplitude of multipath i • ti– Amplitude of multipath i
Wideband multipath signals N-1 j i Received signal r(t) = ai e p[t–ti] i = 0 Instantaneous received power: N-1 |r(t)|2 = |ak|2 k = 0 =>Total received power = sum of the power of individual multipath components.
Average wideband received power N-1 Ea, [PwB] = Ea, [ |ai exp ji|2] i = 0 N-1 _ = ai2 i = 0 Ea,= average power _ ai2= sample average signalusing multipath measurement equipment.
Narrowband multipath signals N-1 ji Received signal: r(t) = aie p[t–ti] i = 0 Instantaneous received power: N-1 ji |r(t)|2 = | aie |2 i = 0
Average narrowband received power N-1 ji (t, t) Ea, [PwB ]= Ea, [ | aie |2 ] i = 0
Conclusions • When the transmitted signal hasa wide bandwidth >> bandwidth of the channel multipath structure is completely resolved by the receiver at any time and the received power varies very little. • When the transmitted signal has a very narrow bandwidth (example the base band signal has a duration greater than the excess delay of the channel) then multipath is not resolved by the received signal and large signal fluctuations occur (fading).
Example Assume a discrete channel impulse response is used to model urban radio channels with excess delays as large as 100 s and microcellular channels with excess delays not larger than 4 s. If the number of multipath bins is fixed at 64 find: (a) t (b) Maximum bandwidth, which the two models can accurately represent.
Solution For urban radio channel Maximum excess delay of channel tN = N t = 100 s. N = 64 t = tN /N = 100 s /64 = 1.5625 s Maximum bandwidth represented accurately by model = 2/ = 1.28 MHz
For microcellular channel Maximum excess delay of channel tN = N t = 4 s. N = 64 t = tN /N = 4 s /64 = 62.5 ns Maximum bandwidth represented accurately by model = 2/ t = 32 MHz
Example Assume a mobile traveling at a velocity of 10m/s receives two multipath components at a carrier frequency of 1000 MHz. • The first component is assumed to arrive at t = 0 with an initial phase of 0 and a power of –70dBm. • The second component is 3dB weaker than the first one and arrives at t = 1 s, also with the initial phase of 0.
... Example If the mobile moves directly in the direction of arrival of the first component and directly away from the direction of arrival of the second component, compute the following: (a) The narrow band and wide band received power over the interval 0-0.5s (b) The average narrow band received power.
Solution(a) Narrow band instantaneous power N-1 ji (t,t) |r(t)|2 = | aie |2 i = 0 Now –70dBm => 100 pw so a1 = √ 100 pw and –73dBm => 50 pw so a2 = √ 50 pw i = 2pd/ = 2pvt/ = (3*108)/(100*106) = 0.3 m 1= 2p*10*t/0.3 = 209.4 t rad.
2 = -1= -209.4 t rad. t = 0 |r(t)|2 = | √100 + √50 | 2 = 291pw t = 0.1 |r(t)|2 = |√100 e j209.4 x 0.1 + √50 e -j209.4 x 0.1| 2 = 78.2pw t = 0.2 |r(t)|2 = |√100 e j209.4 x 0.2 + √50 e -j209.4 x 0.2 | 2 = 81.5pw
t = 0.3 |r(t)|2 = 291pw t = 0.4 |r(t)|2 = 78.2pw t = 0.5 |r(t)|2 = 81.5pw
Wideband instantaneous power N-1 |r(t)|2 = |ak|2 = 100 + 50 = 150 pW k = 0
(b) Average narrow band received power Ea, [PCW ] = [2(291) + 2(78.2) +2(81.5)] /6 =150.233pw • The average narrow band power and wideband power are almost the same over 0.5s. • While the narrow band signal fades over the observation interval, the wideband signal remains constant.
Small-scale multipath measurements • Direct Pulse Measurements • Spread Spectrum Sliding Correlator Measurement • Swept Frequency Measurement
Types of Small Scale Fading Doppler Spread Multipath time delay Slow fading Fast Fading Flat fading Frequency Selective Fading
Mechanisms that cause fading • 2 main propagation mechanisms: • Multipath time delay spread • Doppler spread • These two mechanisms are independent of each other.
Multipath terms associated with fading Ts = Symbol period or reciprocal bandwidth Bs = Bandwidth of transmitted signal Bc= Coherence bandwidth of channel Bc= 1/(50)where is rms delay spread
Calculation of Delay Spread __ _ 2 = 2 - ( )2 Where: _ = ( ak2) / ( ak2) __ 2 = ( ak22) / ( ak2)
Fading effects due to Doppler spread fc = frequency incident signal Received signal spectrum = fc+/- fd fd = Doppler shift fc V
Doppler spread and coherence time Doppler frequency shift: fd = (v / ) cos , Wavelength = c / fc Maximum Frequency deviation = fm = v / Doppler Spread BD = fm Coherence time = Tc = 0.423 / fm
Mathematical estimation of fading Flat fading • Mobile channel has constant gain and linear phase response. • Spectral characteristics of the transmitted signal are maintained at receiver • Condition: Bs<< Bc => Ts >>
Frequency selective fading • Mobile channel has a constant gain and linear phase response over a finite bandwidth • Condition: Bs> Bc => Ts <
Flat fading or frequency selective fading? Common rule of thumb • If Ts ≥ 10 => Flat fading • If Ts < 10 => Frequency selective fading
Fast fading channel • The channel impulse response changes rapidly within the symbol duration. • This causes frequency dispersion due to Doppler spreading, which leads to signal distortion. • Condition: Ts > Tc Bs < BD
Slow fading channel • The channel impulse response changes at a much slower ratethan the transmitted signal • Velocity of mobile (or velocity of objects in channel) • Condition: Ts << Tc Bs >> BD
Rayleigh and Ricean distributions • In mobile radio channels, the Rayleigh distribution is commonly used to describe the statistical time varying nature of the received fading signal • When there is a dominant (non-fading) signal component present such as LOS propagation path, the small scale fading envelope distribution is Ricean
Statistical Models • Probability density function: p(r) = (r/2) e –(r2 + A2) Io(Ar/2 ), for r 0 (22) p(r)= 0 for r < 0 Io Modified Bessel function r Received fading signal voltage A LOS amplitude (A=0 for Rician) 2 Variance of fading signal
Level crossing and fading statistics • Level crossing rate (LCR) is the rate at which the normalized Rayleigh fading envelope crosses a specified level in a positive going direction. LCR = NR= (2)fme-2 fm= Maximum Doppler frequency = R/Rms = specified level R, normalized to the rms value of fading signal
Average fade duration • Average period of time for which the received signal is below a specified level R. __ • = e2– 1 ________ fm2
Example (a) For a Rayleigh fading signal, compute the positive going level crossing rate for = 1, when the maximum Doppler frequency (fm) is 20 Hz. (b) What is the maximum velocity of the mobile for this Doppler frequency if the carrier is 900 MHz?
Solution = 1 fm = 20 Hz The number of zero level crossings is: NR = 2 (20) e-1 = 18.44 Crossings/Sec Maximum velocity of mobile = fd = 20 (3 X 10⁸)/(900X106) = 6.66 m/s
Example Find the average fade duration for threshold level = 0.01, = 0.1 and = 1, when the Doppler frequency is 20 Hz.
Solution = e2 – 1 fm2 0.01 19.9s 0.1 200s 1.0 3.43ms
Statistical methods for fading channels • Clark’s model for Flat Fading • Two-Ray Rayleigh Fading Model • Saleh and Valenzuela Indoor statistical Model • SIRCIM (Simulation of Indoor Radio Channels Impulse Response Models) • SMRCIM (Simulation of Mobile Radio Channel Impulse-Response Models)