Download
1 / 23
230 likes | 370 Views
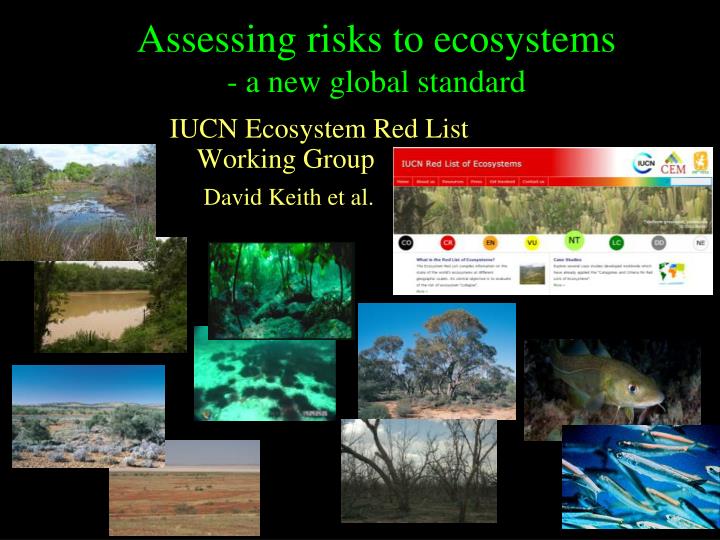
Assessing risks to ecosystems - a new global standard. IUCN Ecosystem Red List Working Group David Keith et al. Major scientific challenges. What is an ecosystem? When is an ecosystem “extinct”? disappearance or transformation? How to assess ecosystem change? distribution function.

E N D
Assessing risks to ecosystems- a new global standard IUCN Ecosystem Red List Working Group David Keith et al.
Major scientific challenges • What is an ecosystem? • When is an ecosystem “extinct”? • disappearance or transformation? • How to assess ecosystem change? • distribution • function
I. Defining ecosystems No global classification, ecosystems may be defined at various scales (raindrops – oceans) Approach: • Adopt widey accepted conceptual definition (Tansley 1935) • Develop a risk assessment method applicable to any classification • Promote development of a global ecosystem classification • Require documented ecosystem descriptions as part of each risk assessment
Describing ecosystems for assessment • Description template • Classification (IUCN habitats, etc) • List defining biotic features • Identify defining abiotic features • Describe key ecosystem drivers • Maps (time series, projections) • past, present, future Conceptual definition (4 key elements, Tansley 1935) • characteristic assemblage of biota • associated physical environment • processes & interactions between components • among biota • between biota & environment • Spatial extent
II. The concept of ‘risk’ RISK – the probability of a bad outcome over a specified time frame Define the bad outcome • An endpoint to ecosystem decline • Ecosystems rarely disappear or go “extinct” (cf. species) • “Collapse”: transformation of identity (characteristic biota & function), replacement by a novel ecosystem
Probability Population size • Species extinction • When is a species extinct? – when population size = 0 (Precise definition!) • How many are there now? e.g. population size 0-50 (Uncertain measurement!) Ecosystem collapse – sources of uncertainty 0 Ecosystem distribution • Ecosystem collapse (functional decline, degradation) • Measurement is uncertain (e.g. how polluted is the river?) • Definition is also uncertain (how much pollution signals collapse?) Ecosystem collapse (distribution decline)- When has ecosystem collapsed? – when distribution area = 0 (Précise définition) - How much is there now ? – e.g. mapped area 0-50 (Uncertain measure) NEED TO DEFINE THRESHOLD(s) OF COLLAPSE - Ecosystem description
II. The concept of risk • RISK – the probability of a bad outcome over a specified time frame • Specify the time frame for assessing change • long enough to detect trends, • short enough to inform action, • long enough to consider lags & debts • past, present, future
III. Assessing ecosystem change Guiding principles for design of a protocol • Evidence-based risk assessment using all available data & information • Transparent derivation from relevant ecological theories • Generic concepts and methods adaptable across a range of organisational & spatial scales and all ecological domains • terrestrial, freshwater, marine, subterranean • Logically consistent with IUCN Red List criteria for species
Threatening processes Ecosystem distribution Ecosystem function A Declining distribution C Environmt’l degradation Risk of loss of characteristic native biota D Altered biotic processes B Small distribution E Quantitative risk analysis Threatening processes III. Assessing Ecosystem Change Risk model for ecosystems • threats to defining features (distribution & function) • multiple mechanisms (causes of threat) • 4 symptoms (of decline) = 4 criteria • plus one overarching criterion (probability of collapse)
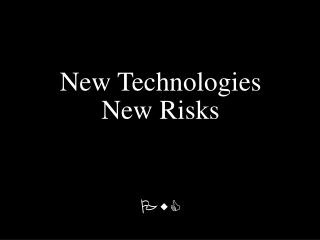
A. Decline in distribution • Change in wetland distribution • 1960 – 2000 • Contraction • Expansion • Time series data (maps, sightings) 2 observations • Data quality & interpretation are important • “garbage in, garbage out” 10% net increase in distribution (Keith et al. 2010) Criterion A = Least Concern
Extent of Occurrence (EOO) Area of Occupancy (AOO) B. Restricted distribution Minimum convex polygon c.5000 km2 Estimating distribution size • 2 metrics:- polygon, grids • subcriteria • qualitative evidence of decline • exclude small fragments • 1% occupancy rule • scale-sensitive • standardised methods of (spatial) estimation • broad/fine ecosystem units Endangered: B1 & B2 10km cells occupied (46) occupied >1% (12)
B. Estimating distribution size Estimates of area depend on map scale (cf. grid cell size) Coarse scale 544 km2 Medium scale 416 km2 Standard methods of area measurement needed to ensure consistency - 10 km2 grid cells Fine scale 348 km2 Coarser scale ~ larger area estimate
Criteria C & D: functional decline- degradation of abiotic environment (C) - disruption of biotic processes (D) Varied pathways of functional decline • Relative severity • Extent (% of distribution) • Immediacy • Current • Future • Historic
Selecting variables for assessing functional declines (C & D) Must represent key ecosystem driver or threatening process • Proximal variables better than indirect ones • Ecosystem-specific variables better than generic ones • Sensitive variables better than insensitive ones • Choice informed by cause/effect process models
a c b d Cause – Effect Process Models • Simple summaries of how an ecosystem works (diagrams) precip evap flux • Upland swamps • water balance controls vegetation change • variable selection (criterion C): • precipitation • evapotransipiration • groundwater filtration
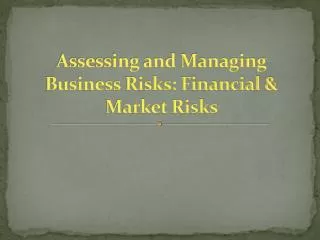
Cause-effect process model – Alaskan kelp forests Pinipeds Commercial exploitation Humans Great whales Killer whales Dietary shift Fish Trophic cascade in Nth Pacific coastal marine ecosystem Sea otters Predation Urchins Facilitation Source: Estes et al (1998, 2009), Springer (2003, 2008) Herbivory Kelp Kelp forest Urchin barren ?
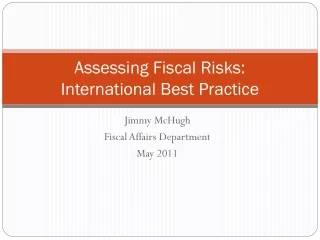
Estimating relative severity of functional decline Select functional variable(mean ann max river hgt) Estimate ‘collapse state’ (450-500 cm) Estimate initial state (712 cm) Estimate current state (619 cm) Calculate range-standardised decline 100*(observed)/(collapsed) = 35-44% (past 50 yrs) Max River Hgt >700cm Criterion C1 = VULNERABLE Max river hgt 500 cm Max river hgt <400 cm
E. Quantitative analysis of risk of collapse • Enables synthesis across all threats and mechanisms of collapse • Ecosystem simulation models • Simple scalar models • State transition models • Complex flux models (trophic, energy, matter) • Varied data requirements • Progress: one pilot study, research proposal
Risk assessment outcomes- Coastal upland swamps, SE Australia LC EN-CR contracting future distribution LC EN EN LC LC EN-CR declining bioclimatic habitat suitability DD DD DD DD DD A B C D Risk assessment implicates climate change as greatest threat • adaptation strategies E
Risk assessment outcomes- Caribbean coral reefs, west Atlantic Ocean Overall status is EN-CR past on current & historic declines in coral cover • Disease mgt, climate adaptation A DD DD DD LC LC LC NE Sea Surface Temps need further interp NE NE VU-CR, observed decline in coral cover DD EN hindcast decline in coral cover DD B C D Photo: M.Spalding E
Trial of Red List criteria for Ecosystems 18 detailed case studies • terrestrial, subterranean, freshwater, marine • Africa, Australia, Europe, North America, South America • Data rich, data poor • All criteria A-E Outcomes of 8 out of 9 IUCN assessments agreed with assessments done by local authorities
Thank you • IUCN Commission on Ecosystem Management • MAVA Foundation • EcoHealth Alliance • Fulbright Program • Smithsonian Institution, Washington DC • Provita, Caracas • Tour du Valat, Arles • Australian Centre of Excellence for Environmental Decisions, Melbourne • Centre de Suivi Ecologique, Dakar • Many Collaborators!