Download
1 / 12
180 likes | 579 Views
AFFINITY DIAGRAM. Dr. Ömer Yağız Department of Business Administration Eastern Mediterranean University. What is Affinity Diagram?.

E N D
AFFINITY DIAGRAM Dr. Ömer Yağız Department of Business Administration Eastern Mediterranean University
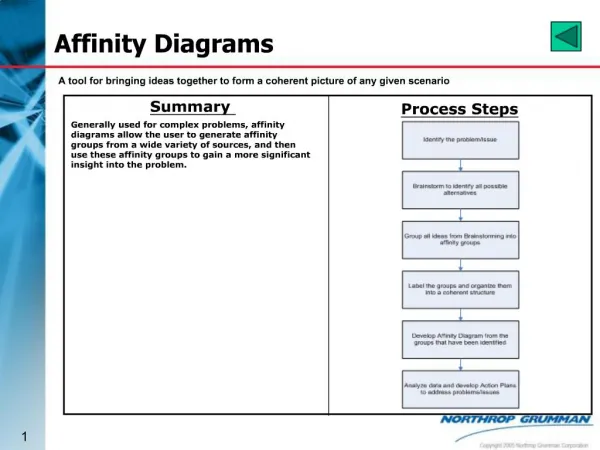
What is Affinity Diagram? Affinity diagramming (also known as the KJ method after its creator, Kawakita Jiro) is the organized, consolidated output resulting from a brainstorming session in which a large number of ideas or issues have been generated. It is used when the issues being investigated are numerous and complex, and the thoughts on how to deal with the issue are in disarray.
What is Affinity Diagram? contd... In using this technique, individual ideas or items are grouped under a common header that best summarizes or consolidates those ideas or items. In this way, a great many items can be reduced to a smaller number of related groups. The groups then become the basis for an action plan or an approach to solving a problem.
Why use Affinity Diagrams? To allow a team to creatively generate a large number of ideas/issues and then organize and summarize natural groupings among them to understand the essence of a problem and breakthrough solutions.
Benefits of Affinity Diagrams • Encourages creativity by everyone on the team at all phases of the process • Breaks down longstanding communication barriers • Encourages non-traditional connections among ideas and issues • Allows breakthroughs to emerge naturally, even on long-standing issues
Benefits of Affinity Diagrams contd... • Encourages “ownership” of results that emerge because the team creates both the detailed output and general results • Overcomes “team paralysis” which is brought on by an overwhelming array of options and lack of consensus
Procedure for Affinity Diagramming 1. A team of people familiar with the issue or problem is formed. 2. Phrase the issue under discussion in a full sentence. (Why does our engineering textbook not sell better?) 3. Brainstorm at least 20 ideas or issues. No judgements or criticism of ideas at this stage. Record each idea on a Post-it note in bold large print to make it visible 2 m. away.
Procedure for Affinity Diagramming contd... 4. Sort ideas or issues into 5-10 related groupings. Move Post-it notes where they fit best for you. Without asking, simply move any notes that you think belong in another grouping. Sorting will slow down or stop when each person feels sufficiently comfortable with the groupings. 5. For each grouping, create summary or header cards using consensus.
Affinity Diagramming Illustration Assume that a textbook publisher is not happy with the present sales volume of an engineeringtextbook. A team carries out a brainstorming session and comes up with a number of ideas as to "why does not our textbook sell better?" In order to proceed further in the analysis of thisproblem, the team next prepares the affinity diagram shown in the next slide.
FINAL AFFINITY GROUPING Writing issues Artwork issues Pedagogical issues Production issues • Reading level • too high • Poor • drawings • Drawings not • produced by CAD • Limited in • scope of coverage • Writing • style complex • Drawings do not • comply w/ANSI • Paperback • cover • No chapter • objectives • Not enough • complex • examples • Too few • sub-headings • Sloppy • production • No chapter • summaries • Paragraphs too • long • No key • terms • Not enough • variety • Poorly written • Superficial • review questions • No color • photos • No design • projects • Poor drawing package • No glossary