Download
1 / 21
290 likes | 718 Views
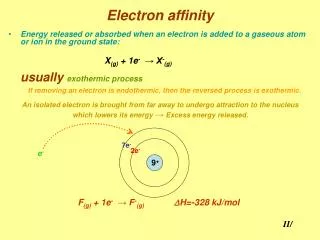
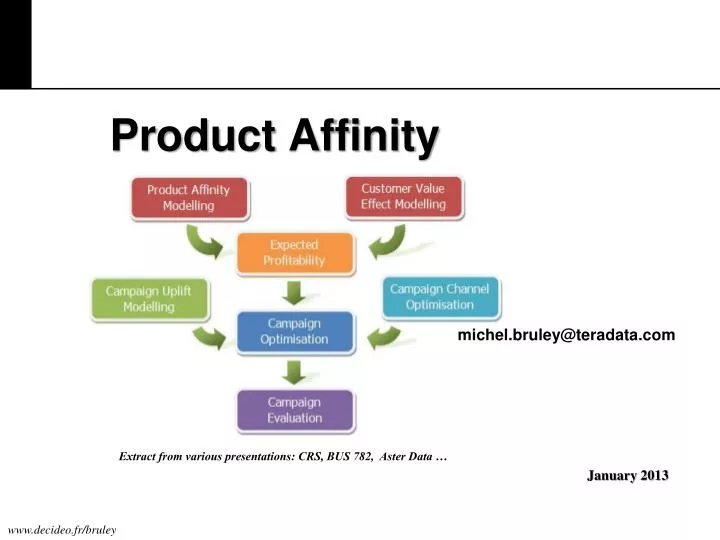
Product Affinity. michel.bruley@teradata.com. Extract from various presentations: CRS, BUS 782, Aster Data … . January 2013. Product affinity analysis is one of the basket analysis techniques. Product Affinity Definition .

E N D
Product Affinity michel.bruley@teradata.com Extract from various presentations: CRS, BUS 782, Aster Data … January 2013
Product affinity analysis is one of the basket analysis techniques
Product Affinity Definition • Identify which products are sold together and use that information to influence targeted marketing efforts, store layouts, and in-store promotions • Product Affinity enables an organization to detect product/service purchase patterns, linkages, and cross-sell opportunities in order to increase revenues. Results from this application will enable the organization to identify, with a high degree of accuracy, those customers most interested in specific products, services and product/service groupings
Affinity Analysis • Affinity Analysis is a modeling technique based upon the theory that if you buy a certain group of items, you are more (or less) likely to buy another group of items. • The set of items a customer buys is referred to as an item set, and market basket analysis seeks to find relationships between purchases. • Typically the relationship will be in the form of a rule: Example: • IF {beer, no bar meal} THEN {chips}
Product Affinity and Cross- Selling • For instance, customers are very likely to purchase shampoo and conditioner together, so a retailer would not put both items on promotion at the same time. The promotion of one would likely drive sales of the other • A widely used example of cross selling on the internet with market basket analysis is Amazon.com's use of suggestions of the type: • "Customers who bought book A also bought book B", e.g.
Product Affinity Analysis Process • Historic market basket data and analyzes are used to build more effective marketing programs: • Past customer purchase data is used to identify which products/services are acquired by which customer groups • Predictive analytics is applied to this data to discover profiles of customers most likely to buy the products in each group • These profiles are used to target those customers most likely to respond favorably to specific cross-sell campaign • Pair-wise product associations are also determined to enable the constructed of offers featuring the purchase of these pair products • Customer product dislikes are also identified so that company does not promote unwanted products • Benefits that can be realized from utilizing this solution: • Improve customer knowledge allowing company to better understand what their customers are likely to buy and not buy. • Increase revenue and decrease costs by identifying those customers most likely to respond to cross-sell campaigns
Behavior Prediction This uses past consumer behavior to foresee the future behavior of their customers. This analysis includes several variations. • Propensity-to-buy analysis- understanding what a particular customer might buy. • Next Sequential Purchase- predicting the customers next buy. • Product Affinity Analysis- Understanding which products will be bought with others. • Price elasticity modeling and dynamic pricing- determine the best price for a given product.
Product Affinity = Link Analysis • Aims to establish links (associations) between records, or sets of records, in a database • There are three specializations • Associations discovery • Sequential pattern discovery • Similar time sequence discovery
Link Analysis: Associations Discovery • Finds items that imply the presence of other items in the same event • Affinities between items are represented by association rules • e.g. ‘When customer rents property for more than 2 years and is more than 25 years old, in 40% of cases, customer will buy a property. Association happens in 35% of all customers who rent properties’.
Link Analysis: Sequential Pattern Discovery • Finds patterns between events such that the presence of one set of items is followed by another set of items in a database of events over a period of time. • e.g. Used to understand long-term customer buying behaviour
Link Analysis: Similar Time Sequence Discovery • Finds links between two sets of data that are time-dependent, and is based on the degree of similarity between the patterns that both time series demonstrate • e.g. Within three months of buying property, new home owners will purchase goods such as cookers, freezers, and washing machines
For Analytics: SQL or SQL-MapReduce Teradata SQL Aster SQL-MapReduce • SQL is better for: • Standard transformations across every element in a table • Standard aggregations using GROUP BY on tables • sum(), max(), stddev() • Dimensional Joins • Set Filtering • Lookups, data pruning to limit a table to a subset. • Presentation formatting • For example, “get me top K counts only” • SQL-MapReduce is better for: • Custom Transformations • e.g. unstructured data, log extraction, conditional manipulation • Custom Aggregations • Inter-row Analysis, like time-series • Layered queries • Nested queries, sub-queries, recursive queries • Analysis that requires reorganization of data into new data structures • Graph analysis, decision trees, etc.
Time Series Analysisdiscover patterns in rows of sequential data Sales Transactions • Aster Data SQL/MR Approach • Single-pass of data • Linked list sequential analysis • Gap recognition • Traditional SQL Approach • Full Table Scans • Self-Joins for sequencing • Limited operators for ordered data {user, product, time} Purchase 1 Purchase 2 Purchase 3 Purchase 4
Cross-Channel Transactions 43M Customers Online Alone! Teradata Aster solution Challenge • Identify correlations between purchases made over time With Aster Data • SQL-MapReduce for market basket analysis indicates correlations between products Impact • Move beyond “people who bought this also bought” to time-based recommendations • Identify common product baskets of interest In-Store Transactions Product Catalog Online Transactions
Overview: For most retailers, Market basket affinity is a well known tool for cross-promotions and marketing. However, there is very little affinity known “outside” the basket. For example, there are many cases where the consumer will return to the store to get the additional item(s) they did not purchase initially. Examples: Electronics retailer (Best Buy, Radio Shack, Fry’s): A Blue-Ray player is purchased online on a given date. The same customer visits the store next week to buy HDMI cables and a B-R disc. Fashion Retailer (Target, Macy’s, J Crew): A customer purchases a dress and hand bag one week. Returns within a month to buy matching shoes. With this sequential affinity analysis, the retailer can send very specific and timely email marketing, to drive traffic and increase revenue. Basket Affinity: Retail Business Need
Overview of Cross-Basket Affinity Cross-Channel Transactions X Customers X Marketing Campaigns Challenge • Difficult to do in a relational DB due to the sheer size of the combinatorial permutations of the various purchasing sequences. • Requires good customer recognition via a credit card database or a customer loyalty card program. With Teradata Aster • Use nPath/Sessionization to identify “super” baskets within a time window. Tighter time window implies higher affinity. • Run Basket Generator to identify the most frequent affinity items & subcategories. Impact • Enables more accurate targeting of customer needs; reduce direct marketing spend, increase revenue yield. Transactional DB Customer Loyalty Retail EDW Product/Item Hierachy Marketing/Promotions
Cross-Basket Affinity Example Aster MapReduce Platform Prepares multi-structured data • Stitches rows together by customer in a time-ordered view Scans all records to produce complete set of sequences • No need to define patterns in advance • Fully parallelized for scalable performance using MapReduce where not feasible with SQL/SAS Summarize sequential affinity output for business exploration • Rank order the most popular sequential purchase paths. Step 1: nPath/ Sessionization to identify “super” baskets. Step 2: run Basket Generator to identify frequent affinity items.
The frequent sequence of purchased items identifies products B & C which are likely to be sold when a customer buys a certain product A. Leverage this Cross-Affinity analysis to run more targeted marketing campaigns; increase affinity purchases Personalized email offers yields higher customer retention and loyalty, and reduces churn. Aster SQL-MR functions nPath/Sessionization and Basket Generators are key algorithmic differentiators; this process cannot be done in a scalable manner in a relational DB and/or SAS Identifies the Cross-Basket Affinity Products
Analyzing item price movements and its impact on: Basket size over a long duration (6-10yrs) will provide key insights into halo impact and affinity contribution for items Basket composition over a long duration (6-10yrs) will provide key insights into price bands for items Analyzing Affinity of items over a long duration (6-10 yrs) will provide key insights into running better promotions, planogram and price planning of around affinity items Affinity Use Case 1/3
Affinity Use Case 2/3 • Affinity Analysis • Analyzing Affinity of items over a long duration (6-10yrs) will provide key insights into running better promotions, planogram and price planning using items affinity • Time Frame: 8 Years, 1 Banner - Data Set: Transaction Data, Product hierarchy • Consumer Migration • Analyzing declines in consumer segments over large timeframes. • Time Frame: 3 Years - Data Set: Transaction Data, Segment Data, Competitor Data, Pricing Data • Pricing Affinity • Analyzing item price movement and its impact on basket size and affinity of items over a long duration (6 years) • Data Set: Transaction Data, Price data - Time Frame: 6 Years • Competitor Impact • Data Set: Transaction/Consumer/Competitor/Pricing Data, Unit_Inf - Time Frame: 8 Years • Social Media • Integrating consumer online data (Social Media - Facebook) with existing transaction data and understand impact on consumer loyalty. • Data Set: Should be collected by vendor
Data ~ 8 years of transaction data (2004 up to Sep-2011) 15 Billion baskets (or transactions) 225 Stores 367K Unique UPCs 12 Categories: Alcohol, Cereal, Frozen – Ice Cream, Laundry Detergent, Cheese (Shredded/Sliced/Chunk/Other), Paper Towels, Pizza & Shelf Stable Juice Solution Aster SQL-MapReduce: Collaborative Filter Query Runtime: 48 minutes (4 Workers using Columnar) Affinity Use Case 3/3