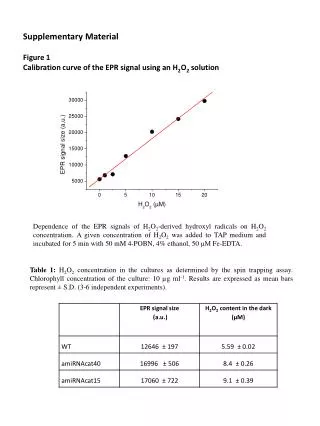
Download

1 / 9

E N D
Supplemental Figure 1 Supplemental Fig. 1. Celastrolrestored the cardiac function in a DOX induced cardiomyopathy model. The DOX group showed a reduction in stroke volume to 26.14±3.0 ml/min (n=17) as compared to CEL+DOX group which showed an improvement to 47.15±6.0ml/min (n=19, *P=0.0041). A decrease in heart rate was observed in DOX group (416±25, n= 13) as compared to CNT (503±25), but in CEL+DOX group (497±13, n=17, *P=0.041) demonstrated near normal heart rates. Similarly, cardiac ouput was preserved in CEL+DOX (24±3, n=17) as compared to DOX group (12±2, n= 17, *P=0.0007). A decrease in LVEDD after DOX treatment (2.9±0.2, n= 15)was restored back to the control levels in CEL+DOX group (3.2±0.2, n= 19). Data is represented as mean±S.E.M. Data was analyzed by one-way ANOVA followed by Kruskal-Wallis test.
Supplemental Figure 2 Supplemental Fig. 2. Quantitative analysis of mRNA expression of MMP2 in the border zone of LV infarct at 3 days post-MI (*P<0.01). Data represented as mean±S.E.M and analyzed using one-way ANOVA followed by Tukey’s post hoc test.
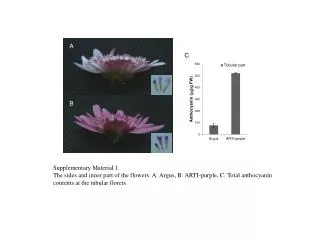
Supplemental Figure 3 Control/ Vehicle 0.2 ml/day CEL (4mg/kg)/day CEL (8mg/kg)/day Heart Lungs Intestine Kidney Pancreas Spleen Liver Supplemental Fig. 3. Absence of change in tissue architecture in mice exposed to different increasing doses of Celastrol. Representative microscopic images of hematoxylin & eosin staining of the tissues harvested from CNT group (n=3), CEL4 group (4mg/kg, n=3) and CEL8 group (8mg/kg, n=3) after administrating CEL for 7 consecutive days
Supplemental Figure 4. A H9C2 CEL duration response B Supplemental Fig. 4. Effect ofcelastrol treatment on cell viability. H9c2 cells were cultured in the presence of 1μM DOX (A), with or without pretreatment of celastrol as indicated. Celastrol was used at 100nM concentration for H9c2. Bar graph shows the maximum cell viability was obtained after a 24 hours pretreatment with Celastrol. *P<0.05, data is shown mean ±S.D. of three independent experiments. B). Killing curve of H9c2 cells with increasing concentration of DOX in the presence or absence of CEL.
Supplemental Figure 5. A R1 R1 R2 R2 CNT DOX R1 R1 R2 R2 CEL CEL+DOX B Supplemental Fig. 5. FACS analysis of AnnexinV in H9c2 cells. A). Dot plot analysis of AnnexinV/PI staining demonstrated that DOX treatment increases the total cell death (R1+R2) and the cells in early apoptotic stage (R2) (n=3). CEL treatment of DOX treated cells significantly reduced the cell death.CELshows no significant effect on the cells. B). Quantitative analysis of Annexin expression. *P<0.05
Supplemental Figure 6. GATA-4 Supplemental Fig. 6. Effect of DOX on mRNA expression levels of cell specific transcription factor in H9c2. DOX induced reduction in GATA-4 mRNA. Celastrol treatment restored GATA-4 to almost normal levels after CEL treatment. Results are mean ± SEM of the indicated mice. *P<0.05. Data was analyzed using one-way ANOVA, followed by Benferroni’s post hoc test.
Supplemental Figure 7. Supplemental Fig. 7. Knockdown of HSF-1 in H9c2 cells. As shown in the graph, expression of Hsf-1 protein was less than 5% in HSF-1 siRNAtrated samples
Supplemental Figure 8. _ _ _ + + + + _ _ _ _ + + + _ _ _ _ + + + Supplemental Fig. 8. Immunoblot showing the effect of triptolideon expression of Hsp70 in Huh7 cells. Cells were treated with CEL, TTD, and TAA . CEL (300nM) TAA (400nM) TTD(100mM) Hsp70 HNF1α HNF4α GAPDH