Download
1 / 25

E N D
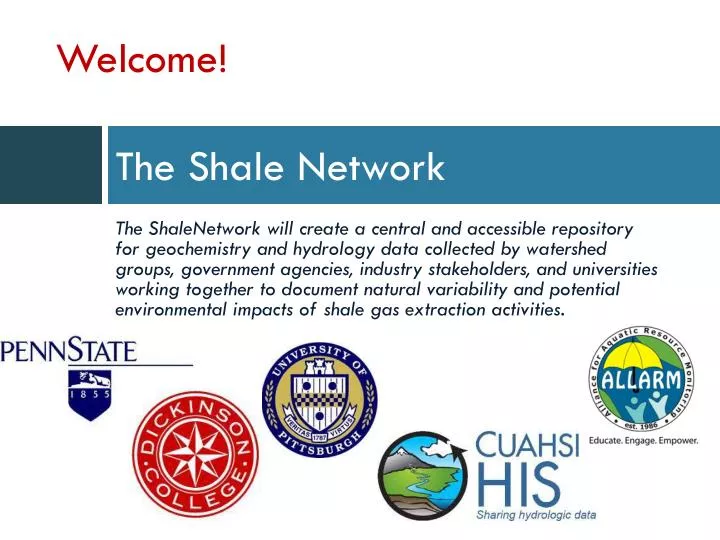
Welcome! The Shale Network The ShaleNetwork will create a central and accessible repository for geochemistry and hydrology data collected by watershed groups, government agencies, industry stakeholders, and universities working together to document natural variability and potential environmental impacts of shale gas extraction activities.
The Shale Network Workshop Susan L. Brantley, Kathy Brasier, Dave Yoxtheimer, Maggie Peacock, Paul Grieve (Penn State) CandieWilderman, Julie Vastine(Dickinson College, ALLARM) Jorge Abad, RadisavVidic, Cesar Simon, Sina Armand (Pitt University) Rick Hooper, Jon Pollak(CUAHSI) May 20 2013 Many thanks to Debbie Lambert and Tracy Bernier as well
Many other participants have contributed ideas, help, time, and data Photo from the annual Shale Network workshop April 2012 (shalenetwork.org). Next workshop: May 19-20, 2013 Teen Shale Network includes high school students from State College High School PA (Teacher Nell Herrmann) and Mountain Ridge High School WV (Teacher Tom Kozikowski)
Goals of the Workshop • To explain to you what we are doing • To learn from you what you are doing • To learn together how to make our efforts more meaningful and important for people to understand potential impacts of hydraulic fracturing on water quality and quantity in regions of shale gas develoment in the northeast
Our Hypothesis An online, shared compilation of water quality and quantity data collected by citizen scientists, government agencies, industry, and university personnel in areas of shale gas production will pull people together and provide the understanding needed to make good decisions.
We are building the ShaleNetwork database as a HydroServer in the CUAHSI Hydrological Information System (NSF facility). CUAHSI’s tool, HydroDesktop, allows people to find the data along with data such as USGS NWIS and EPA STORET. Below: all locations for which Shale Network uploaded data from 10/11 – 12/12 By putting Shale Network data (shalenetwork.org) into the CUAHSI Hydrologic Information System (cuahsi.org), it can be easily accessed with all the other data that are available, using HydroDesktop.
What types of measurements are we including in the database? • Water quantity: discharge rates or stage height, etc • Sensor data (water quantity, water quality) • Analyses of collected samples: ISCO or grab samples • Samples can be collected on a sporadic or regular basis
Summary: A list of our goals and our progress • Goal 1, To identify groups collecting water data in region of shale-gas extraction (starting with Marcellus): See our homepage at shalenetwork.org • Goal 2, Create a sustainable network of the groups by hosting an annual meeting: Welcome to our second annual meeting and please use our forum • Goal 3, Work with CUAHSI to create a database that can establish background and can document impacts: See ShaleNetwork data by using HydroDesktop • Goal 4, Train two graduate students in database development and use for communities: Please be sure to meet Cesar Simon (Pitt Univ) and Paul Grieve (Penn State) • Goal 5, Facilitate community groups in collecting, organizing, and interpreting their data: We are working with ALLARM and with two high schools to input data from citizen scientists • Goal 6, Evaluate hydrogeochemical data using GIS in relation to population and economic data: We are working to assess ShaleNetwork data
Conclusions from Last Year’s Workshop • 1) Extensive data have been collected for areas of shale gas development, but data are hard to access • 2) We need to encourage government and industry to publish data online • 3) We can use database to assess data gaps and needs • 4) We need to prioritize which data to find and upload • 5) The database should be maintained even beyond the three years of NSF funding for Shale Network • 6) The development of the database will help to forge agreements among data providers to standardize or simplify metadata requirements • 7) An interface is needed – other than HydroDesktop -- that allows non-scientists to interact with the data
What about data quality? • We seek data from any group using established data protocols -- from industry sources, government sources, university sources, nonprofits, citizen scientists • Our basic philosophy is that even published peer-reviewed or gov’t data has problems associated with it, so as much as possible we want to put data online with appropriate metadata for researchers to assess…THE BEST WAY TO ASSURE DATA QUALITY IS TO PUT IT ONLINE FOR SCRUTINY • The metadata includes as much information as possible about data quality • If problems are found in data we will note it and possibly remove the problematic data • Publications will be noted where they are available; likewise, use of ALLARM protocol will be noted for citizen groups (and some such protocol will be required)
Our home page www.shalenetwork.org will always show the current datasets we have uploaded..screen shot from 2012
All Shale Network sites, May 2013 Time Series: 58,133 Sites: 22,904 Variables: 786 Total Values: 669,774
Marcellus flowback waters have a signature that you can see in the database • High TDS, Specific Conductance • Often have very high Na, Ca, Cl • Usually relatively high Ba, Sr, Br • Can have high NORMs (e.g., Ra) • Compared to AMD, relatively low concentrations of constituents such as H+, Fe and SO4 • Near-neutral pH Based on data in database, conversations with Carl Kirby, Art Rose, Dave Yoxtheimer, publications, PADEP data, our own measurements
Bromide: all northeastern area Blue triangles (USGS), Red squares (EPA), Black/blue rectangle (Shale Network)
Barium: all northeastern area Blue triangles (USGS), Red squares (EPA), Black/blue rectangle (Shale Network)
Strontium: all northeastern area Blue triangles (USGS), Red squares (EPA), Black/blue rectangle (Shale Network)
Today’s Agenda • 8:00-9:40 We tell you about what we are doing • 9:40-10:05 We provide you with coffee • 10:05 – 10:30 We walk to Willard Building • 10:30-12:15 We teach you about HydroDesktop • 12:30 -1:45 Lunch and Discussion • 1:45 - 2:45 We break up into Small Groups (one Education-focussed group, 3 others) • 2:45 – 4:00 Small Groups Report Back, General Discussion • 4:00 – 4:30 Wrap up Comments • 4:30 Assessment • 4: 45 See you next year…
Welcome And you
Our Idea of the Shale Network • A network of data (we welcome all appropriate data …you can access the data with HydroDesktop) • A network of sites (sites where water quality or quantity data have been measured, see map at ShaleNetwork.org) • A network of developing knowledge (online information will enable understanding) • A network of people (people willing to share data…Please join us by registering at http://www.shalenetwork.org/user/register. We have an online forum and we welcome input)
I don’t want to put data into ShaleNetwork database .. how can I still share data? • Talk to Jon Pollak or Cesar Simon or Jorge Abad about setting up your own HydroServer • Talk to us and we will coordinate with you to make choices about uploading your data so that it will be most useful • We are more interested in helping put data online than we are in insisting that it go into the ShaleNetwork database: we want to help. (For example, we have interacted to help Wilkes Univ create their own database.)
Thank you! • The ShaleNetwork team includes Penn State (Sue Brantley, Maggie Peacock, Kathy Brasier, Dave Yoxtheimer, Greg O’Toole, Paul Grieve, X. Niu), Dickinson College (CandieWilderman, Julie Vastine), Pitt University (Jorge Abad, RadisavVidic, Cesar Simon, SinaArjmand), CUAHSI (Rick Hooper, Jon Pollak) • We especially thank our staff, Debbie Lambert and Tracy Bernier for all the hard organizational work!
Please register to become a member of the ShaleNetwork and please share data • The Shale Network is open to people who monitor water quality, who research water issues, who facilitate water monitoring in areas of shale gas development, or who are members of organizations engaged in these activities. All members must be willing to share water quality or quantity data with the Network. To join, register at http://www.shalenetwork.org/user/register • Once you register, you can share data with us directly online and we will upload it • (If you do not want to be an official member, we will still accept data in any appropriate form)