Download
1 / 43
430 likes | 574 Views
Using COS Data to Inform Program Improvement at All Levels. Every day, we are honored to take action that inspires the world to discover, love and nurture the greatness in all children. Module 6 – Part 2 Using COS Data to Inform Program Improvement: Essentials for Administrators.

E N D
Using COS Data to Inform Program Improvement at All Levels Every day, we are honored to take action that inspires the world to discover, love and nurture the greatness in all children.
Module 6 – Part 2 Using COS Data to Inform Program Improvement: Essentials for Administrators Kids' Potential, Our Purpose
The focus of this module: • Using COS data for program improvement • Consider how to incorporate COS data into activities that answer critical questions for program improvement • Describe different ways to group data to address issues and questions • Examine different types of data and reports that are available and consider how this information can be used for both quality assurance and program improvement at the Local Lead Agency level Kids' Potential, Our Purpose
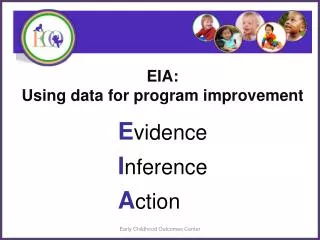
Importance of: • Looking at data on groups of children for quality assurance and program improvement • Reviewing Evidence-Inference-Action steps in data driven decision-making Kids' Potential, Our Purpose
Structuring Conversations About Data • Incorporate data into existing activities • Data-driven discussions can take many forms: • Bring a table, finding, or piece of data to share as background in a bigger conversation, or • Focus a whole meeting on in-depth review of data • Include a wide range of stakeholders • Explain data, encourage dialogue about potential inferences and actions Kids' Potential, Our Purpose
Questions to ask about data • Do the data make sense? Are these data reasonable? • Am I surprised? • Do I believe the data? • Believe some of the data? All of the data? • Why does the data look this way? What caused this? • What do these data tell us about the program? • What additional information would help us consider whether possible inferences might explain the data? • Who else do I need to hear input from to draw inferences about what the data mean?
Reflection: Plans to Discuss Inferences with Stakeholders Take a moment to jot some notes to yourself. Identify at least 2 situations for talking about data with stakeholders. It might be: • A situation where a group of stakeholders already meet and you can begin to incorporate data into the conversation • A group of stakeholders that is important to begin bringing together periodically specifically to discuss data. What would be the first step to making sure this happens? Kids' Potential, Our Purpose
Starting point… USE your data…. Kids' Potential, Our Purpose
Progress Categories • Did not improve functioning • Improved functioning, but not sufficient to move nearer to functioning comparable to same-aged peers • Improved functioning to a level nearer to same-aged peers but did not reach it • Improved functioning to reach a level comparable to same-aged peers • Maintained functioning at a level comparable to same-aged peers
The Summary Statements • Of those children who entered the program below age expectations in each Outcome, the percent who substantially increased their rate of growth by the time they exited the program. • The percent of children who were functioning within age expectations in each outcome by the time they exited the program. Early Childhood Outcomes Center
Other Ways to Think about Summary Statement 1 • How many children changed growth trajectories during their time in the program? • Percent of the children who entered the program below age expectations made greater than expected gains, made substantial increases in their rates of growth, i.e. changed their growth trajectories c + d___ a + b + c + d One summary statement percentage for each outcome
Other Ways to Think about Summary Statement 2 • How many children were functioning like same-aged peers when they left the program? • Percent of the children who were functioning at age expectations in this outcome area when they exited the program, including those who: • started out behind and caught up and • entered and exited at age level • d + e_ _ • a + b + c + d + e • One summary statement percentage for each outcome
COS Progress categories and summary statements for Jazz County Kids' Potential, Our Purpose
Progress Categories and Summary Statements • Do the patterns of progress observed in the group make sense? • Is there anything surprising about: • the percent of children showing greater than expected growth (SS1) • the percent of children exiting at age expectations? (SS2) • What might explain this? • What other data do you want to look at?
COS Data Help Us Know… • COS data provide charts that help you know about the following for a group of children: • The developmental status of the group relative to peers functioning at age-expected levels • at entry to ESIT • at exitfrom ESIT • the patterns of progress observed for the group across their time in the program • The percentage of children with greater than expected growth among children in the program • The percentage of children exiting at age expectations when they leave the program.
Reflection From looking at the data shown in the example on the previous slide, what story can you tell to stakeholders or funders? Be sure the story includes information about: • How children in the group are functioning at entry • How children are functioning at exit • The kinds of progress they make while they are in the program. • Your inference for what it means and actions you might plan to address that. Kids' Potential, Our Purpose
Accountability Stories • Washington uses this information to tell its story about who the program is serving, how it makes a difference for them, and where there are areas for improvement • National reports • Sharing with stakeholders and funders • For accountability and program improvement decisions Kids' Potential, Our Purpose
Extending this… • Examine data for different kinds of groups at different levels… • Individual provider caseload level • FRC level • Program level • LLA/regional level • State level • Groups of programs with common features or training experiences, etc. • Examine group served during certain dates
Using Data to Understand Relationships • Data from the SFP process also helps us understand relationships between things • Examples: • How a child’s functioning at entry is related to functioning at exit • Relationships between progress during time in the program and the child’s characteristics • Relationships between progress during time in the program and the child’s type of disability/delay Kids' Potential, Our Purpose
Looking at Specific Entry-Exit Ratings for Groups of Children .21*33 = 7 .50 * 106 = 53 • How do the data compare to what changes you might expect in the group between entry and exit? • What other data do you want to see? Kids' Potential, Our Purpose
Discussions About Entry-Exit Ratings • Out of 201 children exiting program, number of children with COS entry rating 7, COS rating exit 7: Outcome 1 n= 53, Outcome 2 n= 41, Outcome 3 n= 36 • Example inferences: • Poorer data quality for positive social relationships • Providers tend to rate children high on this outcome; • Assessment tools and observations aren’t very effective at picking up challenges among children • Throughout their time in ESIT, many children are functioning at age-expected levels with regard to positive social relationships. ESIT is effective at supporting families so that children’s delays and disabilities are not influencing social relationships too much. • Possible action steps? Kids' Potential, Our Purpose
Relationships Progress categories and summary statements by child’s ethnicity • Summary Statement 2: Exiting ESIT at Age Expectations • What do you notice in the evidence? • Is the pattern the same or different across all three outcomes? • Is this pattern what you would expect? If not, how does it differ? • Given this pattern, what inference would you make? Repeat these questions with Summary Statement 1: Greater than expected growth trajectories
Other kinds of relationships to examine… • Length of time in service • Age at entry • Gender • Medical Diagnosis • Children in foster care system • And more… Kids' Potential, Our Purpose
Trends Over Time Looking at data over time • allows you to understand if changes you incorporate from improvement plans make a difference • Provides a sense of if the population you are serving changes Kids' Potential, Our Purpose
Questions • Which data to look at depends on your question • Examples of kinds of questions data can help you answer… • Does our program serve some children more effectively than others? • Does our program serve children in some families more effectively than others? • Do child outcomes differ across local programs or service areas? • Do child outcomes differ across programs with different intervention approaches or service features? • Are trends over time showing gradual increases in rates of progress and child achievement? • What might explain major differences in child functioning across outcomes? • What explains differences across various outcomes? • Do programs document more children’s trajectory changes in social-emotional development following adoption of more sensitive assessment tools to measure children’s skills?
Reflection • What do you most want to know about the outcomes for children served by your program? What questions matter most to you? • What can you do to get started? Are there supports you might need to answer those questions? Kids' Potential, Our Purpose
Examples of ways programs, LLAs and administrators might use data… • Open an agency team meeting or CICC meeting by sharing a piece of data and encouraging discussion. • Schedule time for the entire staff to review and discuss data. Ask the group to share their inferences. • Create a brief summary for a stakeholders or funders • Examine reports after data entry as a quality check and for timely data entry. Flag the ones to double check or ask more questions about. • Discuss how practices might link to the data observed during supervision or small group discussion. • Share data with an advisory group or board members about specific topics they are discussing.
Important Point • Discussing and using data underscores the need for quality data. It is critical step to begin to improve the quality of data. • If data quality is a concern, identify local improvement activities to address the issue • Begin discussing and using your data right away! Kids' Potential, Our Purpose
ESIT expectations around using COS data • Professionals should be able to explain how the SFP relates to COS data and why it matters. • All service providers, FRCs, and administrators should be involved in reviewing program data. • Reviewing evidence, making inferences, and identifying actions should be an ongoing part of the program’s continuous improvement cycle and part of ongoing activities with community stakeholders, funders, staff, and families. • Data should be incorporated into reports and improvement plans, including local plans, should be based on data whenever providing information for accountability. • Programs need to support family participation and understanding of COS data at the individual level of the SFP during IFSP meetings and family representation in larger systems-level discussions as well.
Reflection • Are changes needed in your program or region order to consistently meet ESIT expectations around using COS data? • What first step can you take? What additional support might you need? Kids' Potential, Our Purpose
Self-Assessment Tool Kids' Potential, Our Purpose
Using Data Using data is critical. Data • Builds… quality at one level is needed for the data at the next level to be meaningful • Helps us tell a story to stakeholders and funders about why we do what we do and how it is making a difference • Is critical for continuous program improvement and supporting children and families most effectively Kids' Potential, Our Purpose
Resources and Supports around Using Data • ESIT’s Data Management System (DMS) reports on Child Outcome Summary data • Training from LLAs or Program Consultant on using data analysis strategies. Contact information for consultants is available at: http://www.del.wa.gov/publications/esit/docs/ContactsDirectory.pdf • ECTA website at http://ectacenter.org/eco/pages/usingdata.asp Kids' Potential, Our Purpose
Resources and Support with Data Quality Issues Check out the following websites: • http://ectacenter.org/eco/pages/quality_assurance.asp • http://ectacenter.org/eco/pages/training_resources.asp • http://ectacenter.org/eco/assets/pdfs/TrainingandTAResourcesMarch2014.pdf • http://ectacenter.org/eco/pages/usingdata.asp Kids' Potential, Our Purpose
Additional information – ESIT Website under“Information for Providers” link on the ESIT homepage Child and Family Outcomes heading at: http://www.del.wa.gov/development/esit/training.aspx Kids' Potential, Our Purpose
Overview of modules • Module 1: Setting the Stage: Global Child Outcomes and the SFP • Module 2: Learning More About the SFP and COS Rating • Module 3: Essential Knowledge for Completing the SFP and COS Rating • Module 4: Guidance for Completing the SFP and COS Rating Within the Team Process • Module 5: Understanding Age-expected Child Development, Developmental Trajectories, and Progress • Module 6: Using COS Data to Inform Program Improvement: Part 1–Essentials for Providers Part 2–Essentials for Administrators Kids' Potential, Our Purpose
For more information contact your LLA or Program Consultant http://www.del.wa.gov/publications/esit/docs/ContactsDirectory.pdf