Download
1 / 65
670 likes | 1.19k Views
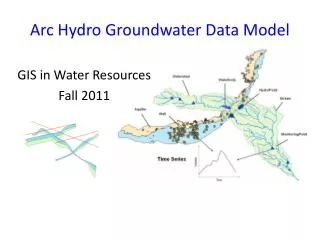
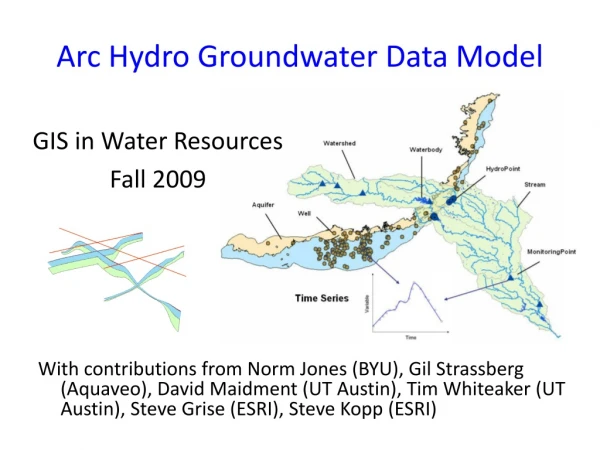
Arc Hydro Groundwater Data Model. GIS in Water Resources Fall 2009. With contributions from Norm Jones (BYU), Gil Strassberg ( Aquaveo ), David Maidment (UT Austin), Tim Whiteaker (UT Austin), Steve Grise (ESRI), Steve Kopp (ESRI).

E N D
Arc Hydro Groundwater Data Model GIS in Water Resources Fall 2009 With contributions from Norm Jones (BYU), Gil Strassberg (Aquaveo), David Maidment (UT Austin), Tim Whiteaker (UT Austin), Steve Grise (ESRI), Steve Kopp (ESRI)
Learning Objectives:By the end of this class you should be able to: • Understand how we describe subsurface features in GIS using the Arc Hydro Groundwater Data Model • Understand the linkages from one subsurface feature to another, and to time series or hydrostratigraphic data
Outline • Background • Arc Hydro Framework • Arc Hydro Groundwater Components
Linking GIS and Water Resources Water Resources GIS
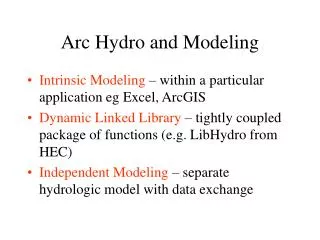
Arc Hydro: GIS for Water Resources Published in 2002, now in revision for Arc Hydro II • Arc Hydro • An ArcGIS data model for water resources • Arc Hydro toolset for implementation • Framework for linking hydrologic simulation models The Arc Hydro data model and application tools are in the public domain
Challenges in developing Arc Hydro • ArcGIS is a very successful static, 2D or 2.5D system • For surface water resources we need • Close connection between raster terrain and vector stream data • Linkage to time varying water data observations stored at gages • Access to precipitation and evaporation data “fields” • For groundwater resources we need • 3D representation of boreholes and hydrogeologic units • Integration with groundwater models, especially MODFLOW, which has become the ArcInfo of groundwater
Arc Hydro Groundwater – Time Line • Arc Hydro book and tools published - 2002 • Initial groundwater data model discussions, initial designs at the Center for Research in Water Resources, UT Austin - 2003 • First complete design of Arc Hydro Groundwater data model - 2006 • Arc Hydro Groundwater presented at ESRI User Conference - 2007 • ESRI and Aquaveo team to develop Arc Hydro Groundwater Tools - 2007 • Arc Hydro Groundwater Tools released - 2009 • Arc Hydro Groundwater book - 2009-2010
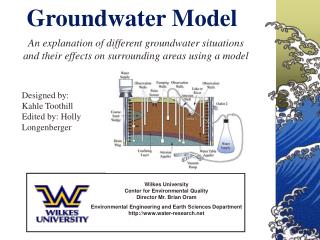
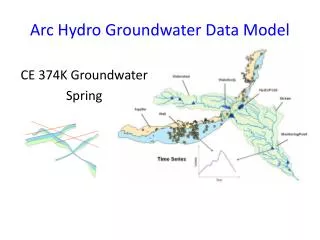
What is a hydrologic data model Booch et al. defined a model: “a simplification of reality created to better understand the system being created” Objects Aquifer Stream Well Volume R.M. Hirsch, USGS
Geologic maps Time series observations Borehole data Groundwater data model (geospatial database) Hydrostratigraphy Geospatial vector layers Numerical models Gridded data Developing a groundwater data model Take a variety of spatial information and integrate into one geospatial database with a common terminology • Better communication • Integration of data • Base for applications
Framework and Components Components can be added to the framework to represent specific themes in more detail Surface water components Groundwater components Network Geology Framework Drainage Borehole data Hydrography Hydrostratigraphy Channel Simulation Temporal (enhanced)
Arc Hydro Framework • Basic representation of surface water and groundwater • Components can be added to the framework to represent specific themes in more detail
Well • Wells are the most basic features in groundwater databases • Attributes of wells describe the location, depth, water use, owner, etc.
Well • Wells are defined as 2D point features • Only some basic attributes are predefined to describe the well use, and geometry and relationship with aquifers Wells in the Edwards Aquifer
Aquifer features • Polygon features for representing aquifer boundaries and zones within them • Representation of Aquifer maps
Aquifer features • An aquifer is defined by one or a set of polygon features • Aquifer features can be grouped by HGUID
Hydro Features • Key attributes for feature identification • HydroID – Unique ID within the geodatabase (internal relationships) • HydroCode – Public identifier (external relationships)
HydroID • A new ID assigned to features in a Arc Hydro geodatabase • Uniquely identifies features within a geodatabase • Is used to manage relationships between features and to relate features with tabular data (e.g. time series) • Custom tool for managing HydroIDs
HydroCode links to external applications • Web interface for groundwater data in Texas • Texas Water Information Integration & Dissemination (WIID)
Aquifer and well • Well features are related to Aquifers: The AquiferID of a well feature is equal to the HydroID of an aquifer feature • An aquifer can be associated with one or more wells (1:M relationship) • Can take a different approach to support M:N relationship Aquifer Well 1 HydroID HydroID HydroCode HydroCode LandElev Name WellDepth HGUID * AquiferID FType AqCode HGUID FType
Aquifer and well Well HydroID = 53
Monitoring Well ( 295443097554201 ) Sink Creek San Marcos springs Springs San Marcos Wells and TimeSeries Wellfeatures are related with time series (water levels, water quality)
MonitoringPoint has time series Monitoring points are related with time series (streamflow, water quality, precipitation)
Integration of surface water and groundwater data The common framework supports analysis of surface water and groundwater data together Well in the Edwards Aquifer) Streamflow Gage at Comal Springs, New Braunfels Texas
Surface water - groundwater linkage Relationships between surface water and aquifer enable analysis based on spatial and hydrologic relationships Streams over the outcrop = recharge features
Implementing the Arc Hydro framework 1. Create the classes of the Arc Hydro Framework (manually using ArcCatalog or by importing from an xml schema) 2. Add project specific classes, attributes, relationships, and domains as necessary 3. Document datasets and changes made to the data model 4. Import data into the framework classes (e.g. streams, wells, aquifers, time series) 5. Assign key attributes to uniquely identify the features and establish relationships 6. Apply tools to create new features and calculate attributes 7. Visualize data and create products (maps, scenes, reports)
Components • Geology - Representation of data from geologic maps • Wells and Boreholes – Description of well attributes and borehole data • Hydrostratigraphy – 2D and 3D description of hydrostratigraphy • Temporal – Representation of time varying data • Simulation – Representation of groundwater simulation models (focus on MODFLOW)
Geologic maps A geologic map is a cartographic product that portrays information about the geologic character of a specific geographic area • Groundwater features are closely tied to geology • Geologic maps vary in scale (continental, regional, local) • Provide a simple data structure to support mapping Geology Aquifers Maps from the United States National Atlas (http://nationalatlas.gov/).
Geologic map databases Geodatabase design for storing data from the Geologic Atlas of Texas (http://www.tnris.org/news.aspx?id=244) Arc Geology: generic geologic map data model implemented within ArcGIS (figure from Raines et al. 2007)
Geology component GeologyPoint: Point feature (e.g. springs, caves, sinks, and observation points) GeologyLine: Line features (e.g. faults, contacts) GeologyArea: Areal features (e.g. rock units and alteration zones) Map modified from: Geologic map of the Edwards Aquifer recharge zone, south-central Texas. U.S. Geological Survey SIM 2873
Components • Geology - Representation of data from geologic maps • Wells and Boreholes – Description of well attributes and borehole data • Hydrostratigraphy – 2D and 3D description of hydrostratigraphy • Temporal – Representation of time varying data • Simulation – Representation of groundwater simulation models (focus on MODFLOW)
Well databases • Wells are basic features in groundwater databases • Attributes of wells describe its location, depth, water use, owner, etc. • Data are collected from drilling/construction reports and permits
Well databases • Well databases store information on wells and related data • Data are related to wells such as construction, water levels, water quality, and stratigraphy • Usually a central table is used to describe well features and other data are linked to it through key attributes (e.g. state well number) Relationships in the TWDB groundwater database
Well • The Well location is defined as a 2D point in the Well feature class • In the Arc Hydro model we only predefine a set of basic attributes Wells in the Edwards Aquifer
Borehole data • 3D data (screens, completion intervals, stratigraphy) are referenced along the well • From depth (top) – To depth (bottom)
BoreholeLog table • Used to store 3D borehole data related with well features • Each row in the table represents a point/interval along a borehole • Data are related with a Well feature through the WellID attribute • 3D geometry is defined by the TopElev and BottomElev attributes
3D features (BorePoints and BoreLines) • Can create 3D features representing data in the BoreholeLog table • BorePoint is a 3D point feature class for representing point locations along a borehole (e.g. geologic contacts, samples) • BoreLine is a 3D line feature class for representing intervals along a borehole
Components • Geology - Representation of data from geologic maps • Wells and Boreholes – Description of well attributes and borehole data • Hydrostratigraphy – 2D and 3D description of hydrostratigraphy • Temporal – Representation of time varying data • Simulation – Representation of groundwater simulation models (focus on MODFLOW)
Hydrogeologic units “Hydrogeologic unit is any soil or rock unit or zone which by virtue of its hydraulic properties has a distinct influence on the storage or movement of ground water” (USGS glossary of hydrologic terms) Hydrogeology can be derived by classifying stratigraphic units Hydrogeologic units Stratigraphic units Upper confining unit Georgetown Fm. Georgetown Fm. (GTOWN) Cyclic + Marine member (CYMRN) Pearson Fm. Leached + collapsed member (LCCLP) Edwards Aquifer Regional dense member (RGDNS) Grainstone member (GRNSTN) Kirschberg evaporite member (KSCH) Kainer Fm. Dolomitic member (DOLO) Basal Nodular member (BSNOD) Upper Glen Rose (UGLRS)
Hydrogeologic unit table • HydroGeologicUnit table provides a conceptual description of hydrogeologic units • Hydrogeologic units can be attributed with an AquiferID such that they can be grouped to represent an aquifer • Spatial features are indexed with a HGUID to relate to the conceptual representation of the units
Representations of hydrogeologic units • Different spatial representations of hydrogeologic units with 2D and 3D objects • Workflow for creating 3D hydrogeologic models
Hydrogeologic unit table • Hydrogeologic units are described with different spatial instances (outcrops, borehole intervals, surfaces, cross sections, and volumes) • HGUID is the key attribute GeoArea Polygon feature class 1 SectionLine PointZ feature class * GeoSection Multipatch feature class HydrogeologicUnit Table HGUID GeoRasters Conceptual description Raster dataset HGUID GeoVolume Multipatch feature class Spatial description
GeoArea • 2D polygons defining boundaries of hydrogeologic units • GeoArea (conceptual/interpolated boundary) ≠ GeologyArea (mapped outcrop) GeologyArea features represent data from geologic maps GeologyArea Data points representing top elevations of the Kainer formation GeoArea feature representing the Kainer hydrogeologic unit
Representation of Cross Sections • SectionLinedefines the 2D cross section • GeoSection represent 3D sections as 3D features • SectionID of the polygon relates back to the section line B B’ A’ A
GeoRasters • Raster catalog for storing and indexing raster datasets • Can store top and bottom of formations • Each raster is related with a HGU in the hydrogeologic unit table Georgetown Person Kainer Glen Rose
K (feet/day) GeoRasters • GeoRasters also store hydraulic properties such as transmissivity, conductivity, and specific yield Raster of hydraulic conductivity in the Edwards Aquifer
GeoVolume • Objects for representing 3D volume objects • Geometry is multipatch - Can create the volumes as a set of 3D triangles • Not real volume – can’t do any 3D operations
Components • Geology - Representation of data from geologic maps • Wells and Boreholes – Description of well attributes and borehole data • Hydrostratigraphy – 2D and 3D description of hydrostratigraphy • Temporal – Representation of time varying data • Simulation – Representation of groundwater simulation models (focus on MODFLOW)
Types of time varying datasets • Single variable time series (time series) – A single variable recorded at a location, such as stream discharge or groundwater levels • Multi-variable time series (attribute series) – Multiple variables recorded simultaneously at the same location, such as chemical analysis of a water sample • Time varying surfaces (raster series) – Raster datasets indexed by time. Each rater is a “snapshot” of the environment at a certain time. • Time varying features (feature series) – A collection of features indexed by time. Each feature in a feature series represents a variable at a single time period.
Time series • The most basic case is a monitoring device recording values over time (e.g. monitoring well, streamflow gage) Monitoring Well (295443097554201) Sink Creek San Marcos springs Springs San Marcos San Marcos River
Time series Time (TsTime) • TimeSeries table is the basic table for storing time series data • Need to support: what, where, and when • VariableDefinitiontable describes variables Space (FeatureID) Variables (VarID)