Download
1 / 42
490 likes | 765 Views
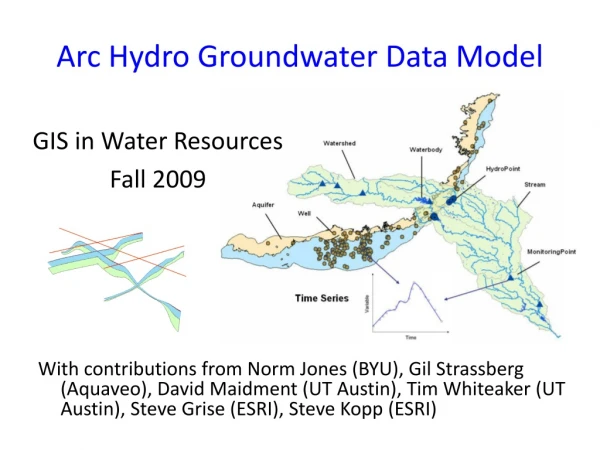
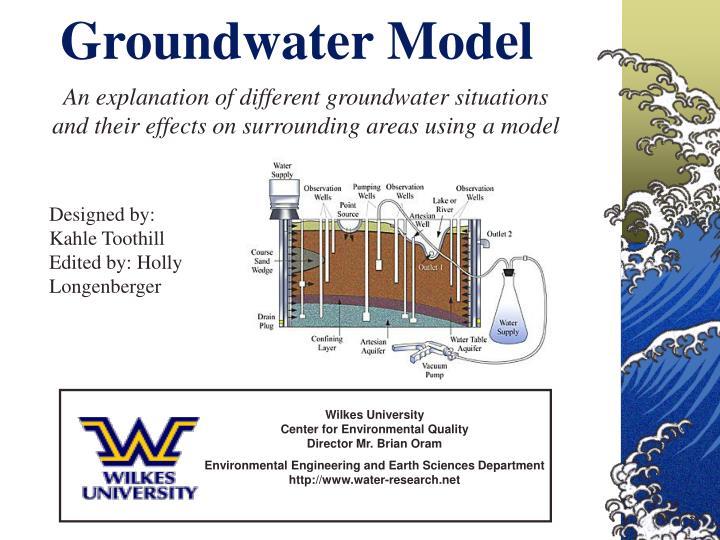
Wilkes University Center for Environmental Quality Director Mr. Brian Oram Environmental Engineering and Earth Sciences Department http://www.water-research.net. Groundwater Model. Designed by: Kahle Toothill Edited by: Holly Longenberger.

E N D
Wilkes UniversityCenter for Environmental Quality Director Mr. Brian Oram Environmental Engineering and Earth Sciences Departmenthttp://www.water-research.net Groundwater Model Designed by: Kahle Toothill Edited by: Holly Longenberger An explanation of different groundwater situations and their effects on surrounding areas using a model
Project Sponsors • Pocono Northeast Resource Conservation & Development Council http://www.pnercd.org • C-SAW Program - Consortium for Scientific Assistance to Watersheds Program http://pa.water.usgs.gov/csaw/ • PA Association of Environmental Professionals http://www.paep.org
Degrees Programs Environmental Engineering (ABET Accredited – BA and BS Degrees) Water and Wastewater Treatment, Hydrology, Air Quality, Hazardous Waste Management, Bioremediation, Stormwater Management, Land Reclamation Earth & Environmental Sciences (BA and BS Degrees and Secondary Education Degree Opportunities) Water Quality, Soils, Geology, Geographic Information Systems (GIS), Global Positioning Systems (GPS), Freshwater and Marine Ecosystems, Global Positioning, Land-Use Planning, Field Training, Environmental Analysis Environmental Engineering and Earth Sciences Department
Environmental Engineering National Recognized and Accredited (ABET) Bachelor of Science (BS) Degree Earth & Environmental Sciences 4-Year Programs for a Bachelor of Arts (BA) Degree Bachelor of Science(BS) Degree Also available: A minor Secondary Education Certification (7-12) Elementary Education Certification (1-6) Wilkes University Environmental Engineering and Earth Sciences Departmentvisit us at:http://www.wilkes.edu/pages/388.asp
Geographic Information Sciences Center Visit for more information: http://www.wilkes.edu/pages/388.asp Academic courses -curriculum includes GIS, GPS, remote sensing, and photogrametry technologies Training -ESRI Software and Certified Trimble Pro XR GPS Training Projects Presentations Center for Environmental Quality Visit for information: http://www.water-research.net Laboratory Testing Water Quality Monitoring Homeowner Outreach Program Community and Business Outreach Programs Environmental and Professional Education and Training Applied Research, Product Testing and Technology Transfer Wilkes University
Wallops Island Marine Consortium Wilkes is a participating member in the Wallops Island Marine Consortium in Virginia. The purpose of the consortium is to allow students to work at a marine field station and gain first hand knowledge relating to the marine environment and environmental science. Back Mountain Recreational Center Field Station “natural laboratory” dedicated to field-based training and research. a secure and permanent site for long-term monitoring of natural processes. students gain valuable field experience in collecting, handling and field analyzing samples of rock, soils, sediment, groundwater, surface water and vegetation. Wilkes University For more details visit: http://www.wilkes.edu/pages/606.asp http://www.wilkes.edu/pages/926.asp
Water LevelsWater Moves from Areas of High Pressure to Low Pressure No Horizontal Flow Source of water • Water Moves from Recharge to Discharge Zone • Some water lost thoughevaporation • No lateral water movement • Water is lost due to evaporation
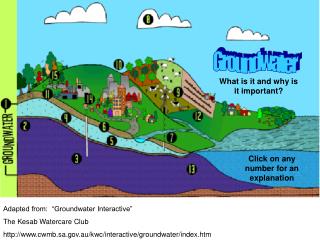
GroundwaterHow much do we use each day? http://ga.water.usgs.gov/edu/wups.html
IntroductionWater Levels- They Are Not Static ! • The water level in a system is controlled by the location of the groundwater recharge and discharge zones and the amount of water withdrawn or injected into the system. • The static levels in lakes, ponds, wells, etc. will change in response to changes in precipitation, evaporation, water withdrawals,water injection, and groundwater discharge. • Static water levels in confined aquifers respond to changes in barometric pressure, water withdrawals, surface activities, and water injection or recharge into the groundwater system.
Scenario 1Groundwater Comes From Nearby Sources • The upside-down water bottle on the left of the model represents our water source which is theRecharge Zone.
Scenario 2Water Flows From Recharge Zones to Discharge Zones • Recharge Zone: The area where water enters the groundwater flow system. The direction of flow is downward. • In the saturated zone - All spaces between soil and rock are filled with water • In the unsaturated zone - the pore spaces are filled with air and water. • Discharge Zone: The area in which groundwater leaves the system either as a spring, stream flow, wetlands, direct evaporation, water withdrawal, or large water body (lake, ocean, estuary, bay, etc).
Scenario 2Water Flows From Recharge Zones to Discharge Zones • Water moves from areas of high head or elevation to low head or lower elevation. • The use of food coloring will help to see how the water moves through the system.
Scenario 2Water Flows From Recharge Zones to Discharge Zones • Water moves from many zones within the model below, food coloring is used to show how water travels in a system. Typically water flows from high head /high elevation to a low head / lower elevation.
Scenario 3Introduction to Well Pumping • Groundwater is pumped from the ground through wells for use in our homes, businesses, and industries. • Drilled into aquifers • An underground layer of rock and sand that is saturated may contain a sufficient amount of water to support a single family unit with a sustainable yield of 1 gpm or higher. • Pumps typically remove water from the wellbore. In the case of an artesian well, no pump may be needed to bring the water to the surface.
Scenario 3Introduction to Well Pumping Our “pump” is inserted into a well and the water is drawn into the flask on the right.
Scenario 4Relationship Between Groundwater & Surface Water • Groundwater supports and “feeds” lakes, streams, wetlands, and the ocean, especially during dry periods as baseflow. • Springs: locations were the piezometric surface intersects the ground level. The lake is filled to an elevation that is equivalent to the water table. The arrow (artesian well) represents a discharge from the deeper confined aquifer.
Scenario 5Aquifers are Not Uniform Different types of soil, rock, gravel, and sand make up the ground. These types of structures hold, store, and, release different amounts of water depending on the properties of the material. http://ga.water.usgs.gov/edu/earthgwaquifer.html
http://ga.water.usgs.gov/edu/earthgw.html Scenario 6Springs Lower the Level of the Water Table • TheWater Table • is the top of the saturated zone. • has many peaks and valleys in its shape due to the topography of the land. It fluctuates in response to precipitation, evapotranspiration, and groundwater recharge or discharge. • the level below which the soil is saturated with water and head is 0 or greater. (2)
Scenario 6Springs Change the Level of the Water Table • The level of the water in the pipet tip with the green fluid represents the piezometeric surface of the “artesian” aquifer. • Water level is above lake level. • At the current lake level - The removal of the pipet tip would cause the artesian water to be “pumped” into the lake. Piezometeric Surface Water Table
Scenario 6Springs Change the Level of the Water Table • Water in a spring is water moving through the hydrologic cycle. • Springs are sources of water high in minerals. • Springs are vulnerable to pollution and contaminants just like groundwater. http://ga.water.usgs.gov/edu/gwartesian.html
Scenario 7The Texture of the Aquifer Affects the Rate of Groundwater Flow. Aquifer: • underground units of rock, soil, and other unconsolidated material that can store and transmit water. • may be separated by confining layers. Confining Layers: • layers which have fine pores that transmit water slowly. • must have a permeability 2 orders of magnitude lower (100 x lower) than the adjacent aquifer to be a confining layer. • examples could be unfractured bedrock, fine sand over coarse sand, and silt or clay layers.
Scenario 7The Texture of the Aquifer Affects the rate of Groundwater Flow. • Under saturated conditions, the gravel layer will have a higher permeability. • Water also travels through sand, silt, and, clay but the rate of movement is a function of the degree of saturation, hydraulic gradient, and permeability. • Water does not move easily or readily through the confining layer. Water movement is a function of permeability (K) and hydraulic gradient (dh/dl). Sand Gravel layer Confining layer
Scenario 7The Texture of the Aquifer Affects the rate of Groundwater Flow. • The lower the friction between the soil particles, the higher the velocity of the water moving through it. • Water in an aquifer takes path of least resistance. • Under the same gradient and saturated conditions, the dye tends to move faster in the gravel because of the higher permeability of the material.
Scenario 8Drawing Water from a Well Can Interfere with Neighboring Wells The pumping of this well acts as an artificial discharge zone that influences the natural groundwater flow, induces drawdown, and reverses the direction of groundwater flow.
Scenario 8Drawing Water from a Well Can Interfere with Neighboring Wells The over pumping of a well or excessive groundwater withdrawal can cause: • The level of water in other wells to drop and the yield in these wells to decrease. • Water levels in nearby surface water may drop and the rate of discharge from the system via natural processes will decrease. • This is well interference and over-pumping can cause “Groundwater Harvesting”.
Scenario 9Human Activities Near the SurfaceCan Contaminate Groundwater • Red food coloringwas added to the model as a point source or“contaminate”. • The contaminate could be lechate from a landfill, leakage from a septic systems,or a plume of oil from an old heating oil tank etc. • Contaminates move through the unsaturated zone of the soil, then into thewater table, and eventually to a discharge zone. • Examples of possible discharge zones: lake, stream, ocean, wetlands, water wells, and springs.
Scenario 9Human Activities Near the SurfaceCan Contaminate Groundwater
Scenario 9Human Activities Near the SurfaceCan Contaminate Groundwater Contaminate Because the shallow well was pumped, the contamination was pulled from the shallow water aquifer into the deeper aquifer. If the well was not pumped the contamination would not have contaminated this zone.
Scenario 9Human Activities Near the SurfaceCan Contaminate Groundwater The initial contamination spreads quick. It eventually spreads into wells and the lake. The water that was spilled into the point source eventually runs throughout the model and exists at the discharge zone.
Scenario 10Wells Can be Contaminated by Human Activities at the Surface • A well being pumped draws water into it from all directions- including downgradient. • Pumping wells alters natural groundwater flow and can reverse the direction of flow. (What was downgradient is NOW upgradient). • Point and Non-Point Contamination can influence groundwater quality
Scenario 11Contaminated Groundwater May Pollute Surface Water • Water collecting in the lake is not clear, because a portion of the water is contaminated by a series of non-point sources of pollution. • Baseflow: The portion of streamflow which comes from groundwater. • Contaminants in groundwater can be discharged into surface water sources (discharge zones). This can cause acute/chronic environmental impacts on terrestrial and aquatic ecosystems.
Scenario 12Water Quality Can Vary Within an Aquifer • Observe the colored water “contaminates”. • At first the plumes are narrow. • Later they become wider as the water flows through the formation and contamination disperses and diffuses. • Soon contamination plumes have widened to the point that there is a zone of contamination. Zone of Contamination
Scenario 12Water Quality Can Vary Within an Aquifer • MOVEMENT OF CONTAMINANTS • Diffusion: is the movement of particles (ions or molecules) from an area of higher concentration to an area of lower concentration.(3) Example: A contaminate going into the groundwater. • Advection: a process of movement in which a contaminant can be transported by water migration. • Degradation: absorbs contaminants so they move at a slower rate than the water in an aquifer (dilution). • Retardation: pollutants tend to disassociate into negative and positive ions. Soil can then attract, absorb or repel the pollutant.
Scenario 13Wells Can Pollute Groundwater • Well defects: • cracks, holes, rusted casing, loose cap, eroded grout, lack of grouting, insufficient casing, or poor well construction. • cause contaminated surface water to get into groundwater supply. • state regulations exist concerning proper construction, maintenance, and, abandonmentfor community and non-community wells, but NOT most Private Wells in PA.
Scenario 14Once Groundwater is Contaminated, the Contamination May Persist for Long Periods of Time • Observe the colored water in the model. This is what could happen to the ground as a result of pollution. • Eventually, the pollution will be flushed out of the model and back to a pristine state. In order to get it back to this condition, it could take hundreds to 1000s of years.
Scenario 14Once Groundwater is Contaminated, the Contamination May Persist for Long Periods of Time • Unlike the model, the environment can’t eliminate or flush pollutants easily or quickly ! • Contaminants may move a few feet/year or less ! • Eventually contaminates will reach discharge zones and may be partially eliminated by natural processes ! • If contaminates are not removed they end up in sources of freshwater or the ocean!
http://www.atsdr.cdc.gov/HEC/HSPH/warning.jpg Scenario 14Once Groundwater is Contaminated, the Contamination May Persist for Long Periods of Time http://www.egr.msu.edu/tosc/grandcal/images/contsed.gif http://soc.hfac.uh.edu/artman/uploads/envir02r.gif
Conclusion… • Make smart decisions when it comes to our water usage. • Dispose of Wastes Properly. • Encourage Recycling Programs. • Use Environmentally Safe Products (Look for Green Products). • Make conscious decisions in land-use planning and development. • Encourage Private Well Construction Standards and Proper Well Siting Guidelines. • Get your drinking water tested on an annual basis.
Project Sponsors • Pocono Northeast Resource Conservation & Development Council http://www.pnercd.org • C-SAW Program - Consortium for Scientific Assistance to Watersheds Program http://pa.water.usgs.gov/csaw/ • PA Association of Environmental Professionals http://www.paep.org
Wilkes UniversityCenter for Environmental Quality Environmental Engineering and Earth Sciences Department http://www.water-research.net Wilkes University Wilkes offers a wide range of information and services such as: • Degree Programs in Environmental Engineering and Earth Environmental Sciences • Center for Environmental Quality Water Research Laboratory • Geographic Information Systems and Remote Sensing Center • Professional and Continuing Training/ Education Opportunities • Technological Support and Grant Partner Visit us at:
References 1. Sand-Tank Ground Water Flow Model Manual. Wayne Woldt. University of Nebraska, Department of Biological Systems Engineering. 2. Ohio Department of Natural Resources- Division of Water Publications. http://www.dnr.state.oh.us 3. Memorial. University of Newfoundland. http://www.mun.ca