Download
1 / 12
120 likes | 304 Views
Chicken QTL Phenotype Ontology. Wilfrid Carr é , Jan Aerts, Dave Burt, Andy Law Roslin Institute, Genetics and Genomics. ENSEMBL Project. What are we trying to achieve : Add function over the genome sequence. Integrate the QTL data to the Chicken Genome. How are we going to that?

E N D
Chicken QTL Phenotype Ontology Wilfrid Carré, Jan Aerts, Dave Burt, Andy Law Roslin Institute, Genetics and Genomics
ENSEMBL Project • What are we trying to achieve : • Add function over the genome sequence. • Integrate the QTL data to the Chicken Genome. • How are we going to that? • Get and organise all the QTL data. • Make it easily available (via cMap, ArkDB, ENSEMBL, UCSC…). • Work out where it maps on the genome. • Allow cross species comparison with synteny comparison.
Mapping QTL data Use Cases : • Map the QTL on Consensus linkage Map, Genome assembly, RH Map, Cytogentic Map. based on position on common flanking markers. Browse by chromosome numbers or animal trait ontology tree Retrieve all available information for each QTL. Search by chromosomes, trait names and/or key-words in the publication.
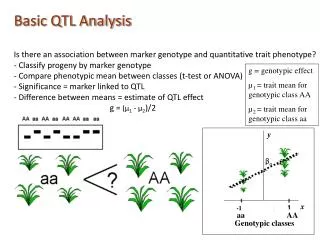
Mapping QTL data Chicken Genome assembly Statistical test 0 10 20 30 40 50 Map Position (cM) 60 70 Significant Suggestive 80 90 Chicken QTL data in ArkDB : http://www.thearkdb.org/ QTL study QTL QTL map Linkage Map
Chicken QTL data QTL data collected for Chicken : - 111 Publications - 227 different traits - 1508 chicken QTL/Associations found Different kind of data : - Association study (439 Associations, 40 studies) - QTL analysis (1058 QTLs, 60 studies) - Causative genes (11 genes, 11 studies) Data : - QTL description (Trait, Age, Chromosome, Position, Flanking markers, Significance, Genome / Chromosome wise, QTL effect on the trait, …) - Parameters of the study (Type of Cross, Number of animals in the study, Breed, Description, Statistic / Software used ….) - References (Title of the publication, Authors, Journal, PubMed ID, Laboratory, Contact e-mail)
Classification of Traits Trait Ontology : - Mammalian Phenotype Ontology (MGI website) not suitable for production traits. - Define a 3 level Ontology based on the different publications : Body traits Behavior Immune response Reproduction - Define a 3 level Ontology based on the different publications : Body traits Carcass traits Fat Growth traits Meat quality Metabolic traits Muscular system Nervous system Organs Plumage Skeletal system - Define a 3 level Ontology based on the different publications : Body traits Fat % Abdominal fat weight Abdominal fat weight Abdominal fat weight / BW Abdominal fat width Fat distribution Skin fat weight Skin fatness
Classification of Traits Chicken Chr1 GR BWt BWt BWt %AF BWt EWt_to AFE EN_to EN_to AFE MD_R MD_R GR %CARCASS BWt %SF BWt Body trait Infectious disease Reproduction female
Issues with Traits • Interactions between traits / Traits belonging to different group : Thigh meat / bone ratio. Meat colour adjusted for body weight. Weights of heart, liver and gizzard (g). • Trait given at a specific age or stage: • Body weight at 5 weeks of age under Ascites Condition (g). • Feed intake in a fixed weight interval. • Environmental conditions : • Same trait in different environmental condition not necessary the same meaning. • Body weight at 5 weeks of age (g) • Body weight at 5 weeks of age under Ascites Condition (g) • Body weight post transport to the processing factory
Issues with Traits • Different way to look at and to classify traits : ROSLIN Body traits Skeletal system Body traits Skeletal system Body traits Skeletal system Body traits Carcass traits Body traits Muscular system Tibia width Tibia length Thigh bone Thigh weight Thigh muscle ATO Egg Quality Production traits Egg Quality Production traits Growth Production traits Growth Production traits ROSLIN Reproduction fem Egg prod Reproduction fem Egg prod Reproduction fem Egg shell Reproduction fem Egg comp Body traits Growth Egg weight Total Egg Number Shell weight Albumen weight Test end Body weight ATO Egg production Production traits Egg Quality Production traits Egg Quality Production traits Egg production Production traits Egg production Production traits
Other phenotype databases • Several other databases oriented on trait : OMIM, for human, or MGI for mouse. • Online Mendelian Inheritance in Animals (OMIA) is a database of genes, inherited disorders and traits in more than 135 animal species (other than human and mouse, which have their own resources). • The database of Genotype and Phenotype (dbGaP) was developed to archive and distribute the results of studies that have investigated the interaction of genotype and phenotype.
Conclusion • QTL identified in Human, Mouse and Rat are disease or physiology oriented. Same trait defined differently in farm animals. How to make the connection between different traits? • How to integrate OMIA and OMIM data to the trait ontology? In order to do some comparative mapping necessity to have a similar ontology from one species to an other one. Common trait should be in the same super classe and have almost the same subcategories even if they reflect different production in different species. Necessity to standardize abbreviations of traits.
Example of Comparative Mapping Chicken chr 7 Mouse Human Chr 1 Chr 2 QTL for Body weight Chr 2 Chr 3 Chr 10 Chr 21 Chr 16