Download
1 / 50
500 likes | 600 Views
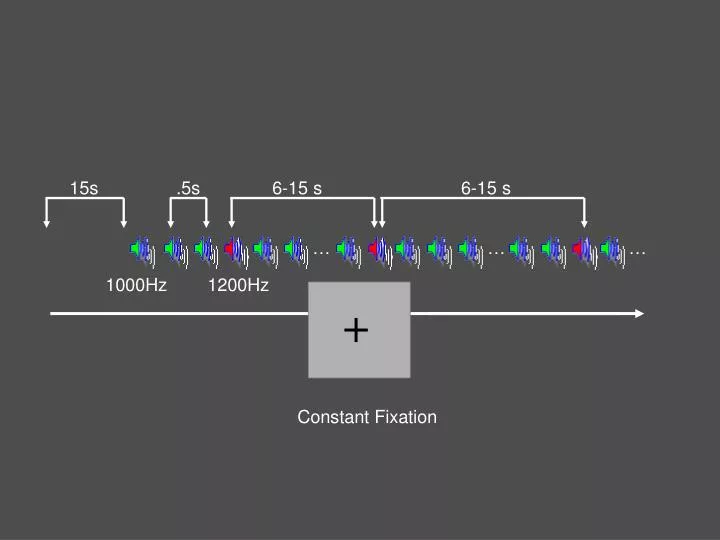
15s. .5s. 6-15 s. 6-15 s. …. …. …. 1000Hz. 1200Hz. Constant Fixation. Controls: N=41, p<1x10 -10. Patients: N=44, p<1x10 -5. MFG, Right Hemisphere, Visit 1. Visit 1. Slice Depth: Y=-36. Controls Patients. Visit 2. MFG, Right Hemisphere, Visit 2. Controls: N=41, p<1x10 -10.

E N D
15s .5s 6-15 s 6-15 s … … … 1000Hz 1200Hz Constant Fixation
Controls: N=41, p<1x10⁻¹⁰ Patients: N=44, p<1x10⁻⁵ MFG, Right Hemisphere, Visit 1 Visit 1 Slice Depth: Y=-36 Controls Patients Visit 2 MFG, Right Hemisphere, Visit 2
Controls: N=41, p<1x10⁻¹⁰ Patients: N=44, p<1x10⁻⁵ MFG, Right Hemisphere, Visit 1 Visit 1 Controls Patients Slice Depth: Z=-11 Visit 2 MFG, Right Hemisphere, Visit 2
STG, Right Hemisphere, Visit 1 Controls: N=41, p<1x10⁻¹⁰ Patients: N=44, p<1x10⁻⁵ Visit 1 Controls Patients Slice Depth: Y=-65 Visit 2 STG, Right Hemisphere, Visit 2
Controls: N=41, p<1x10⁻¹⁰ Patients: N=44, p<1x10⁻⁵ STG, Right Hemisphere, Visit 1 Visit 1 Controls Patients Slice Depth: Z=-3 Visit 2 STG, Right Hemisphere, Visit 2
Axial Slices of Brainstem Averaged Across Populations and Visits Z= -12 Inferior Z= -10 Z= -9 Z= -7 Z= -6 Superior Z= -4
Intra-Class Correlations Dependent Variables Dependent Variables
Correlation between Response to Deviants and Breath Hold in STG(Controls) r= .322, p=.003
Correlation between Response to Deviants and Breath Hold in STG(Patients) r= .246, p= .02
Correlation between Response to Deviants and Breath Hold in MFG(Controls) r= .114, p= ns
Correlation between Response to Deviants and Breath Hold in MFG(Patients) r= -.041, p= ns
Cog WG Auditory Oddball
Average STG Signal Change for Diagnostic Group F = 9.2, p=.003 Control N = 38 Patient N = 39
Average STG Signal Change for Diagnostic Group by Visit Visit 1 Visit 2 Visit 1 Visit 2 Control N = 38 Patient N = 39
Average STG Signal Change for Auditory Deviants by Field 1.5 T 3.0 T 4.0 T
Average STG Signal Change for Breath Hold by Field 1.5 T 3.0 T 4.0 T
Average STG Signal Change By Diagnosis and Field Strength 1.5 T 3.0 T 4.0 T
Average Hemodynamic Time Series Across ROI ACG STG Thalamus Visit 1 = BlueVisit 2 = Red
dlPFC Activation by Auditory Deviants Controls N=38 Patients N=39
dlPFC Activation by Auditory Deviants Controls N=38 Patients N=39 Identical Threshold Reduced Threshold
Cog WG Dual Sternberg MMN Tasks
****** ****** 18 sec 1 P 1 3 7 4 T G Z R 9 7 5 A S V * * * * * * * * * * * * * * * * Dual Visual Sternberg and Auditory Mismatch Rest Set Size 2 Rest Set Size 5 A G T Y H * 1 * 7 * Repeat Fixation Auditory tones: p(1000 Hz) = 0.9, p(1200 Hz) = 0.1 750 ms ISI, 100 ms duration Visual stimuli: block lengths = 18 sec, ISI = 2000 ms 9 sec of fixation at beginning and end of run
Subjects • Fifteen healthy subjects (9 females, 6 males; 13 right-handed, 2 left-handed) • Age range 18 to 28 years (mean age 21.9 years) • All had normal or corrected to normal visual acuity
Rest Low Load High Load Activations to Deviant during load conditions (fixed effects)
High Load Low Load Voxels where Load 5 > Load 2, t>=2 (random effects)
Cog WG Emotional Oddball Task
... ... ... ... ... Emotional Distracter Task Yamasaki, LaBar, McCarthy, PNAS, 2002
Anterior MFG Posterior IFG Emotional Distracter Task
Sad movies Happier Happy movies 9 7 Neutral 5 - Mood + 3 Sadder 1 (min) -4 -2 0 0 2 4 After the movies Before the movies Mood Measurement
Happy Mood Sad Mood 0.25 * Sad stimuli Sad stimuli Neutral stimuli Neutral stimuli Average of % signal change 0 20 20 - - 4 4 - - 2 2 0 0 2 2 4 4 6 6 8 8 10 10 12 12 14 14 16 16 18 18 20 20 - - 4 4 - - 2 2 0 0 2 2 4 4 6 6 8 8 10 10 12 12 14 14 16 16 18 18 Time course (s) - 0.1 Activation of amygdala
Goals for Cog Challenge Group • Evaluate Phase II SIRP design • Did the inclusion of three working memory loads differentiate schizophrenic and control samples? • Evaluate Phase II Auditory Oddball task • Did temporal lobe activation differentiate schizophrenic and control samples? • Cross-task comparisons for Phase II data • Were similar patterns of dorsolateral PFC activation observed in both SIRP and Oddball tasks?
Emotional Distracters and Working Memory Phase II Phase I (14s) (15s) Novel stimuli (6s) + + + 3.5s 1.5s Memoranda Probe
MFG L R MR units IFG MR units TR Scrambled Neutral Emotional