Download
1 / 29
370 likes | 664 Views
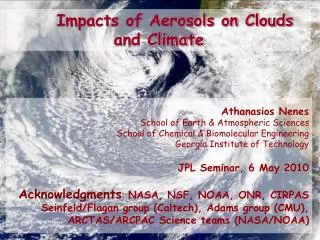
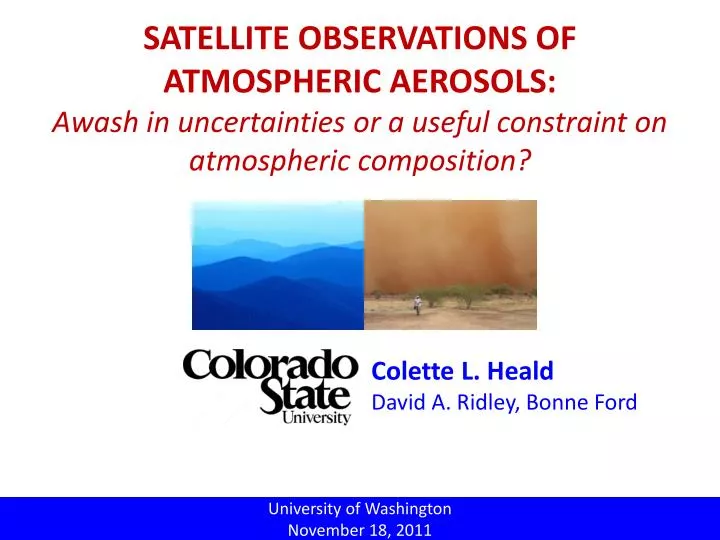
SATELLITE OBSERVATIONS OF ATMOSPHERIC AEROSOLS: Awash in uncertainties or a useful constraint on atmospheric composition?. Colette L. Heald David A. Ridley, Bonne Ford. University of Washington November 18, 2011. ATMOSPHERIC AEROSOLS ARE LINKED TO MAJOR ENVIRONMENTAL ISSUES. CLIMATE.

E N D
SATELLITE OBSERVATIONS OF ATMOSPHERIC AEROSOLS: Awash in uncertainties or a useful constraint on atmospheric composition? Colette L. Heald David A. Ridley, Bonne Ford University of Washington November 18, 2011
ATMOSPHERIC AEROSOLS ARE LINKED TO MAJOR ENVIRONMENTAL ISSUES CLIMATE AIR QUALITY / HEALTH FERTILIZATION
AEROSOLS: A MAJOR CLIMATE FORCER GHGs dominate mass budget in atmosphere… 800+ Pg 10’s of Tg BUT one “molecule” of aerosol is >1x10¹⁸ times more effective than a molecule of CO2 in terms of radiative forcing. Even 1x10¹¹ times more effective than CFCs… [Heald and Worsnop, in prep]
CHALLENGES OF CHARACTERIZATION:HETEROGENIETY, COMPLEXITY Image from: C. Leck Diversity of sources types Size, shape, chemical composition, radiative properties… Aerosol lifetime ~ days not well mixed!
CHALLENGE: OBSERVING AEROSOL COMPOSITION FROM SPACE TO QUANTITAVELY INVESTIGATE AEROSOL LOADING A tough measurement to make! What we are comparing! SIMULATED AOD SATELLITE AOD Assumptions: Optical Properties Size Distributions Aerosol Distributions etc. *DIFFERENT* Assumptions: Optical Properties Size Distributions etc. AEROSOL SPECIATED MASS CONCENTRATIONS What we want to estimate! Dust Carbonaceous aerosols Sulfate Sea Salt Nitrate SURFACE (variable reflectance properties)
SATELLITE OBSERVATIONS: DIFFERENT PLATFORMS, TECHNIQUES, PHYSICS…DIFFERENT AODs! GEOS-Chem (w/ DL) MODIS (Aqua) CALIOP GEOS-Chem Spring Summer MODIS and CALIOP (both in A-Train) observe very different AODs. Moving model target? Accounting for CALIOP detection limits important for model comparison… [Ford and Heald, submitted]
FOCUS ON TODAY: (1) Dust from North Africa (2) Aerosol in the SE US (3) The global budget of organic aerosol
DUST FROM NORTH AFRICA: IMPACTING AQ AND THE BIOSPHERE DOWN-WIND More than half of dust emitted globally from N. Africa TOMS: June 13-21, 2001 summer winter/spring Miami (1989-1997) French Guiana (1978-1979) [Prospero et al., 1981] [Prospero et al., 1999]
SATELLITE CONSTRAINTS ON DUST SOURCE & TRANSPORT GEOS-Chem overestimates observed AOD in source region, underestimates winter/spring export
REALISTIC APPORTIONMENT OF SUB-MICRON DUST MASS Observed Saharan dust size distribution Simulated decrease in AOD [Highwood et al., 2003] OLD NEW Shifted mass to larger sub-micron sizes (less optically efficient). Reduces AOD in better agreement with satellite & AERONET observations
SATELLITE CONSTRAINTS ON DUST SOURCE & TRANSPORT Sub-micron size apportionment significantly improves model agreement with observations. Remaining challenges: Bodélé Depression and outflow
DUST REMOVAL MOVING ACROSS THE ATLANTIC Seasonally averaged AOD along Atlantic-outflow transects Assuming first order loss can estimate lifetime from slope of log-plots… Model removal too strong, especially in winter-spring (transport towards Amazon). Likely excessive removal along the ITCZ. We estimate dust lifetimes in model (~3 days) in spring about 50% of satellite-based estimate (> 6 days).
MODEL CAPTURES AIR QUALITY IMPACTS IN THE CARRIBEAN Barbados R2=0.74 Measurements: J. Prospero (Surprisingly) good simulation of dust transport over 5000 km to the Caribbean!
DEPOSITION OF AFRICAN DUST & PHOSPHOROUS IN THE AMAZON ANNUAL We estimate 17 Tg/yr of dust transported to Amazon annually (lower limit). This is ~10-25% of the P supply for the Amazon. Otherwise from fires and biogenic particles [Mahowald et al., 2005]. Impact of greening of the Sahel on productivity of the Amazon? [Ridley et al., JGR, in press]
FOCUS ON TODAY: (1) Dust from North Africa (2) Aerosol in the SE US (3) The global budget of organic aerosol
IS AEROSOL CONTRIBUTING TO CLIMATE TRENDS IN SOUTHEASTERN US? Summertime trends 1950-2006 Data: Global Historical Climate Network Daily (GHCND) “Although clearly speculative, increasing biogenic secondary organic aerosol/cloud effects linked to forest regrowth and/or interactions with anthropogenic pollution is one possibility that is qualitatively consistent, not only with the spatial structure, but also with the seasonality of the correlation of the unusual negative temperature trends with precipitation found in the southeastern United States.” [Portmann et al., 2009]
SEASONAL AEROSOL MAXIMUM IN THE SOUTHEASTERN US Summer-Winter AOD (MISR) Annual Mean AOD (MISR) Summer-Winter AOD (MODIS) AOD at Walker Branch MODIS MISR Seasonal maximum in AOD consistent with biogenic emissions (implication: biogenic SOA) [Goldstein et al., 2009]
IS THIS CONSISTENT WITH OUR UNDERSTANDING OF AEROSOL IN THE REGION? Spring (MAM) Summer (JJA) NO! Model does not reproduce the Southeastern maximum. Bonne Ford, CSU
BUT, IT’S ALSO INCONSISTENT WITH SURFACE DATA Observed Seasonality of Surface PM Preliminary Comparison of Vertical Profile in the SE US [Malm et al., 2003] Surface data does not indicate that organic aerosol dominates at surface. Also see stronger season cycle in Northeast. Possibly aerosol aloft?
FOCUS ON TODAY: (1) Dust from North Africa (2) Aerosol in the SE US (3) The global budget of organic aerosol
ORGANIC AEROSOL MAKES UP AN IMPORTANT/DOMINANT FRACTION OF OBSERVED AEROSOL Sulfate Organics [Zhang et al., 2007] Globally makes up 25-75% of total fine aerosol at the surface (ignoring dust here)
MODELS UNDERESTIMATE OBSERVED ORGANIC AEROSOL 2001-2009 OA Mass (fine) 2-10! Model underestimate observed OA concentrations by factor of 2-10 in the mean. Big Issue in the community: What is the source of “missing OA”. [Heald et al., submitted] Global Model: GEOS-Chem(2x2.5)
WHY DON’T MODELS GET IT RIGHT…. 10,000’s of (unidentified?) compounds with variable properties Continuing Oxidation/Partitioning in the Atmosphere Uncertain Formation (Missing sources? Poorly understood processes?) Hydrocarbons (gas-phase & particulate) Terpenes (gas-phase) PBAP
HOW LARGE A MISSING SOURCE OF ORGANIC AEROSOL? Goldstein and Galbally [2007] suggest that SOA source may be anywhere from 140-910 TgC/yr. For comparison, current global model (GEOS-Chem) estimates total ~50 TgC/yr Can total aerosol optical depth (AOD) measurements shed any light on the total budget of OA?
IF ONLY AEROSOL IN THE ATMOSPHERE WAS OA, WHAT LOADING IS IMPLIED BY SATELLITE AOD? Calculate the “hypothetical” AOD implied by a constant 1 g/sm3 profile over the land, and see how we need to scale this locally to make up ENTIRE AOD reported by MISR. Inverted total MISR AOD: Surface OA concentrations Inverted OA loading is 3.5 TgC over land. Assume a 6 days lifetime = 215 TgC/yr extrapolate to include outflow ~430 TgC/yr. (middle of Goldstein & Galbally range)
A MORE REALISTIC POSSIBILITY:REMOVE CONTRIBUTIONS FROM DUST, BC, INORGANICS(assuming all the negative bias in the model is ONLY OA) DJF JJA Estimate that ~150 TgC/yr source is required to close the MISR-GEOS-Chem* discrepancy. MISR GEOS-Chem* MISR- GEOS-Chem* *excluding OA
UNCERTAINTY ANALYSIS (boring but important!) Estimated uncertainty on OA budget due to: Uncertainty on OA optical properties Assumed optical properties based on GADS database and log-normal size distribution recently evaluated by Drury et al. [2010] * Except over high RH regions Uncertainty on estimated OA source = 80%
HAVE WE REDUCED THE UNCERTAINTY ON THE OA BUDGET? 910 Range estimated by: Goldstein and Galbally [2007] This is more than THREE TIMES what is currently included in global models…. BUT at the low end of Goldstein & Gallbally [2007] range. 140 Our satellite top-down estimate 150 47 Existing GEOS-Chem sources All units in TgCyr-1 [Heald et al., 2010]
WRAPPING UP Global satellite measurements fill much needed observational gap. But quantitative comparisons (moving beyond pretty pictures) can be challenging