Download
1 / 25
250 likes | 261 Views
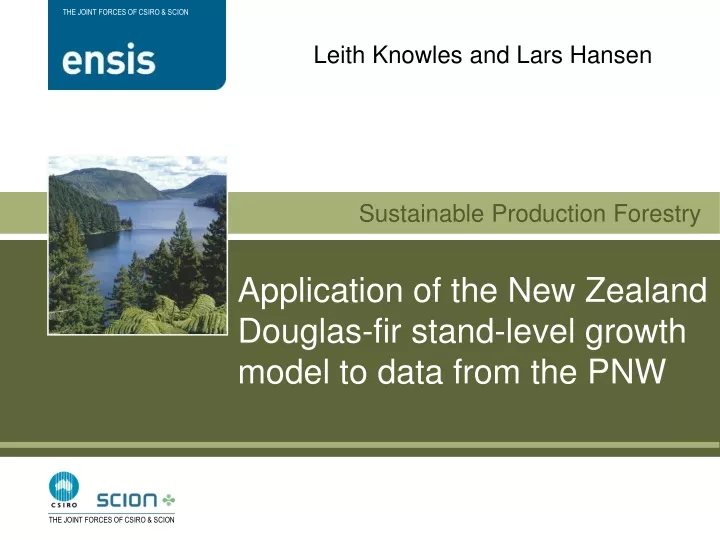
This study applies the New Zealand Douglas-fir stand-level growth model (DF NAT) to data from the Pacific Northwest (PNW). The study examines the relationship between stand-level variables such as site index (SI), basal area (BA), and mortality. The results show that despite some differences, the DF NAT model works well in the PNW region.

E N D
Leith Knowles and Lars Hansen Application of the New Zealand Douglas-fir stand-level growth model to data from the PNW
NZ stand-level growth model (DF NAT) • Based on data from 1600 permanent plots • MTH = fn(SI, age and latitude) • Current annual BA increment = fn(SBAP, age, crown, competition) • Mortality = fn(stocking, DBH) based on Reineke’s 3/2 rule • BA after thinning: BA2 = BA1*(N2/N1)a
PNW validation data • Jim Flewelling facilitated access to data from the Stand Management Cooperative, University of Washington • 27 silvicultural trials (installations) • 303 sample plots • Stands 3-28 yrs of age • Roger Fight, US Forest Service, PNW Research Station also contributed to the study
Different definitions for height to crown base • PNW: height above ground to lowest whorl where 3 out of 4 quadrants contain live branches • NZ: the average of height above ground to lowest live branch, and height above ground to lowest whorl with majority of branches live
Thinning coefficient fitted for each thinning on each plot BA after thinning: BA2 = BA1*(N2/N1)a • PNW first thinning a = 0.77 • PNW second thinning a = 0.82 • Average NZ a = 0.71 • Average GB a = 0.66 • Average Germany a = 0.83
500-Index Volume MAI (m3/ha/yr) for a stand that has been thinned to waste to 500 stems/ha by 15m MTH, and grown on to age 40 years • Best growth installation 717: 17.4 m3/ha/yr • Poorest growth installation 501: 5.5 m3/ha/yr • Average for 27 installations: 12.4 m3/ha/yr • Compares to NZ average of 18.4 m3/ha/yr
Conclusions • SI similar (32m @ 40 years) • SBAP higher in NZ (1.88) vs PNW (1.2) • 500-index higher in NZ (18.4) vs PNW (12.4) • Slightly higher mortality in PNW • DF NAT needed new height-to-crown-base prediction function • Despite productivity differences (BA not SI), DF NAT works well in PNW • Valuable to repeat the exercise in 5-10 years