Download
1 / 22
220 likes | 230 Views
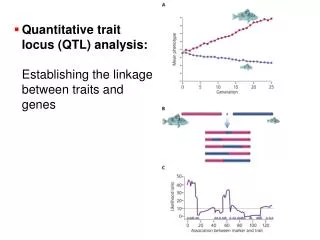
MULTIPLE GENES AND QUANTITATIVE TRAITS. Drosophila Complete Genome Sequence. Science March 24 2000. LINKAGE & LINKAGE DISEQUILIBRIUM. Different loci do not exist in complete isolation from one another.

E N D
Drosophila Complete Genome Sequence Science March 24 2000
LINKAGE & LINKAGE DISEQUILIBRIUM • Different loci do not exist in complete isolation from one another. • Some genes are so close to one another on chromosomes that the rate of recombination between them is very low. • Non-random associations of alleles across loci is referred to as linkage disequilibrium (or gametic phase disequilibrium). • These non-random associations persist longer for physically linked loci, but are also possible for physically separate loci.
LINKAGE DISEQUILIBRIUM CAN BE DISPLAYED IN A TABLE Gametic disequilibrium Genotypic disequilibrium Observed: B1 B2 A1 45 5 A2 2 48 Observed: B1B1 B1B2 B2B2 A1A1 30 5 3 A1A2 2 48 4 A2A2 1 0 30 Expected: B1 B2 A1 25 25 A2 25 25
LINKAGE DISEQUILIBRIUM IN NATURE • Physical linkage among loci is commonplace. • Linkage disequilibrium is reletively rare. • Linkage disequilibrium decays at a fast enough rate that it disappears unless some mechanism maintains it. • The primrose displays one example of linkage disequilibrium:
SOME CAUSES OF LINKAGE DISEQUILIBRIUM • Non-random mating. • A new mutation arises in linkage disequilibrium with other genes in the genome. • The population may have been formed by the union of two populations with different associations among loci. • Recombination may be effectively non-existent (e.g., Y chromosome). • Genetic drift may cause linkage disequilibrium. Some between-locus allele combinations may increase in frequency by chance. • Natural selection may cause linkage disequilibrium.
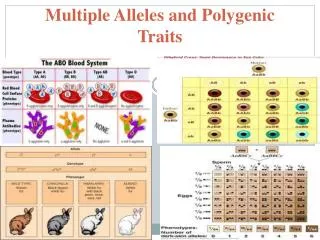
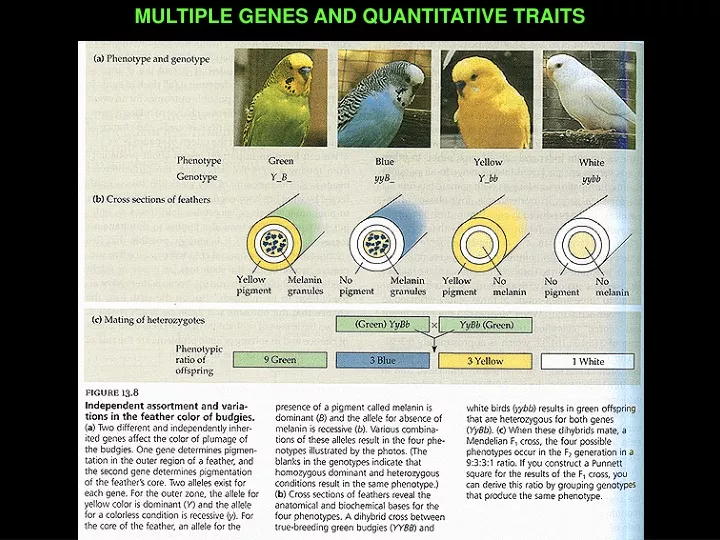
EVOLUTION AT TWO LOCI • Some possible relationships between the loci: • Each locus affects a different character. • They will evolve independently unless there is linkage disequilibrium or the traits have a functional relationship. • Both loci may affect the same character. • The character is said to be POLYGENIC. • Either or both loci may affect two or more characters. • This phenomenon is called PLEIOTROPY.
DIRECTIONAL SELECTION AT TWO LOCI • With two alleles at each of two loci, there are nine possible genotypes. • The relative fitnesses of the nine genotypes can vary in many possible ways. • This example shows: (A) ADDITIVE EFFECTS (B) EPISTASIS
WRIGHT’S SHIFTING BALANCE THEORY “The problem of evolution as I see it is that of a mechanism by which the species may continually find its way from lower to higher peaks... In order that this may occur, there must be some trial and error mechanism on a grand scale by which the species may explore the regions surrounding the small portion of the field which it occupies.” (Wright 1932)
THE SOLUTION: WRIGHT’S SHIFTING BALANCE THEORY PHASE I: Random genetic drift allows a population to explore the adaptive landscape, possibly even crossing “adaptive valleys”. PHASE II: Selection within that population moves it up the hillside to a higher adaptive peak. PHASE III (INTERDEMIC SELECTION): This population now has higher fitness than the other populations, and consequently has a higher growth rate, producing more migrants. These migrants go to the other populations and move them across the adaptive valley as well.
CRITICISMS OF THE SHIFTING BALANCE THEORY • It is very difficult to test or falsify with empirical data. • Phase I (genetic drift) is certainly plausible. • Phase II (individual selection within populations) is also plausible. • Most criticism focuses on Phase III (interdemic selection). • Migration of individuals from the high-fitness population will break up “co-adapted gene complexes”. • Differences in productivity (and migration rates) do not necessarily occur as populations achieve higher fitness. • For interdemic selection to work, populations must meet very stringent requirements with respect to rates of gene flow, the spatial arrangement of populations, and rates of recombination.
SOME MAJOR GOALS OF QUANTITATIVE GENETICS • To estimate the fraction of variation that is genetic vs. environmental in basis. • To explain the resemblance between relatives. • To explain the phenotypic consequences of inbreeding and outcrossing. • To ascertain the degree to which different characters are genetically correlated. • To develop a predictive theory for evolutionary change.
FIELDS THAT BENEFIT FROM QUANTITATIVE GENETICS • Animal & Plant Science • Evolutionary Biology • Human Disease Research • Conservation Biology
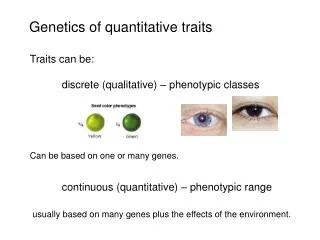
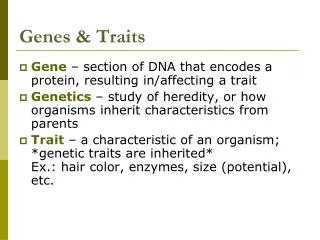
CONTINUOUS CHARACTERS • Up to now we have primarily considered traits with a simple single locus genetic basis. These traits typically have discrete phenotypic classes. Genotypes AA Aa aa • However, many traits are influenced by multiple loci!
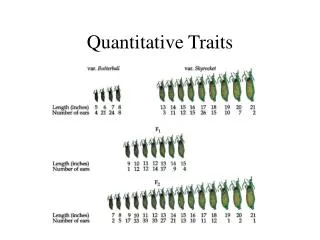
INFLUENCE OF THE NUMBER OF LOCI ON THE DISTRIBUTION OF PHENOTYPES
Polygenic Traits and a Normal Distribution of Phenotypes • If alleles contribute to the phenotype in an additive fashion, increasing the number of genes increases the number of multilocus genotypes and the number of phenotypes. • Consider the number of phenotypes when lower case alleles have no effect on the phenotype and upper case alleles increase the phenotype by a unit of 1. • For example: • a = 0 & A = 1; • Then: • aa = 0, Aa = 1 and AA = 2 Fig. 7.2 Z&E
Environmental Effects Create a Continuous Distribution Fig. 7.4 Z&E
CONTINUOUS DISTRIBUTIONS RESULT FROM TWO CAUSES: • Segregation of multiple genetic factors • Influence of multiple environmental factors Fig. 7.3 Z&E
AN “OUTBREAK OF VARIATION” Cross between a Dachshund and a French Bulldog • Parental Generation • F1 Progeny • F2 Generation FROM: C. R. Stockard. 1941. The Genetic and Endocrine Basis for Differences in Form and Behavior. Wistar Inst. Anat. Biol., Philadelphia, PA