Download

1 / 36

E N D
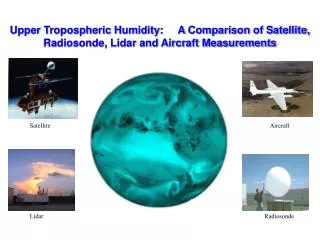
Satellites “Since the early 1960s, virtually all areas of the atmospheric sciences have been revolutionized by the development and application of remote sensing techniques – that is , measurements of atmospheric properties and processes at a distance, using radiation sensors placed in space, on aircraft, and/or on the earth surface.” Storm Grant W. Petty
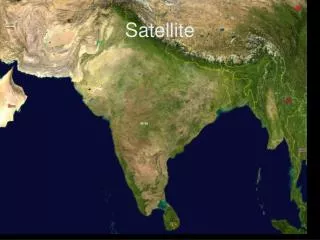
Satellite images Because of satellites we have seen many phenomena that we were unable to see before, in particular over ocean! Hurricane Storm Cloud street Cloud bands
Two major different types of satellites Geostationary vs. Polar-orbiting
GOES SATELLITES (8 and 10) It is difficult to get data beyond 70o north and south.
POLAR-ORBITING SATELLITES An inclination of 90o Sun-Synchronous Orbit The orbit is a special case of polar orbiting (Satellites passing the same area approximately at the same local times every day) - Twice a day - To eliminate diurnal signal in data
Descending Ascending POLAR-ORBITING SATELLITES Denser data over polar regions!
POLAR-ORBITING SATELLITES gap gap gap gap
Satellite Resolutions
Absorption of the Atmosphere The absorption of the atmosphere as a function of wavelength (microns). 100 means atmosphere totally opaque, 0 means atmosphere totally transparent
Visible channel • Satellite receivers receive the reflectance of sunlight. • Strong reflection - cloud and snow • Brighter - thicker cloud • No data during the night time. Sun glint (also 3.9 um – short IR)
Short InfraRed A window region to the atmosphere
Thermal InfraRed (IR) • Detect the temperature (i.e., energy) of the various surface and cloud features visible from space. • Used to estimate the height of cloud tops • (problem with cirrus clouds) • Not a perfect estimation.
GOES Visible and IR images Deep clouds Detecting cloud depth VIS Detecting cloud top (the higher (colder) the cloud top, the brighter the image) IR Low level clouds
GOES Visible and IR images VIS IR
GOES Visible and IR images VIS Enhanced IR
Deep cloud? ? ?
SSM/I • Special Sensor Microwave/Imager • Sun-synchronous • Mean altitude : 830 km • Width of swath : 1400 km • 4 frequencies, 7 channels • 19.3, 22.2, 37.0 and 85.5 GHz • 22.2 GHz received in vertical polarization, the • remaining frequencies received in dual • polarization • (19V, 19H, 22V, 37V, 37H, 85V, and 85H) • Resolutions • 25 Km : 19V, 19H, 22V, 37V, 37H • 12.5 Km : 85V, 85 H • Data over cloud region can be retrieved, but not over land and heavy rainfall areas (a problem of microwave). • Retrieved data • Integrated total precipitable water (TPW) • Wind speed at 10-m height
QuickSCAT • SeaWinds instrument, a microwave radar, aboard the QuikSCAT measuring sea surface wind vectors. • Sun-synchronous • Max altitude : 800 km • Width of swath : 1800 km • Resolutions – 25 km • Data over cloud region can still be retrieved, but not over land and heavy rainfall areas. • Measure wind vectors at 10-m height • Information saturated above 30 m/s • (so no data can be detected above • 30 m/s), same for SSMI
Satellite winds at 10 m height Data available over ocean only!!! QuikSCAT SSM/I Wind overestimated
NASA's Earth Observing System satellites land Latin for Terra Launched 2000 Latin for water Aqua Launched 2002 Latin for air Aura Launched 2004
Aura Launched July, 2004 Courtesy NASA
MODIS • Moderate Resolution Imaging Spectroradiometer • Aboard Terra (2000) and Aqua (2002) • 36 spectral bands: 0.405-14.387 μm • Resolutions: 250m, 500m, 1000m (radiances) • Sun-synchronous • Mean altitude : 705 km (equator) • Width of swath : 2300 km (Terra), 2330 (Aqua)
MODIS IR TPW InfraRed (IR) – 5 km resolution • Derived from bands 24 to 36 (between • 4.47 to 14.24 μm), excluding band 26 • (data available day and night). • Used a statistical regression algorithm, • with an option of a subsequent non- • linear physical retrieval (Seemann et al. • 2003) • => 101-level atmospheric T, dew points, • O3 profiles, and skin T • 101-level vertical T and dew point profiles • = > TPW
MODIS nIR TPW near InfraRed (nIR) – 1 km resolution • Used 2 water vapor absorption bands, • 0.905 and 0.94 μm and 3 water vapor • window bands, 0.865, 0.936, and 1.24 μm. • Used a ratio of reflected solar radiances • between an absorption channel to a • window channel • => water vapor transmittance • A pre-calculated water vapor • transmittance look-up table • = > TPW • The quality relies on water vapor • attenuation of nIR solar radiation reflected • by surfaces and clouds. (daytime only)
MODIS nIR TPW near InfraRed (nIR) – 1 km resolution • Over ocean, only sun glint regions can • have data. • The accuracy of the data is strongly • related to the estimation of surface • reflection. (=>larger error over ocean)
Satellite derived winds Vapor Cloud Problem: The estimation of the height
Cold SST after Katrina passed Satellite derived TPW and SST SSMI, column integrated water vapor Katrina TMI SST
LOW EARTH ORBIT (LEO) RECEIVER Radio occultation geometry Data are not contaminated by heavy precipitation. COSMIC project launched 6 LEOs in 2005 Taiwan was the primary sponsor.
LOW EARTH ORBIT RECEIVER Ray distribution in the occultation plan
Observations • When using satellite data, need to know • What kinds of data? • The frequency of data • The resolution of data • The quality (or error) of data • What is the advantages and disadvantages of in situ and remote sensing data?