Download
1 / 1
10 likes | 108 Views
Table 2. Summary of Results. 2. Methods Design: This study is based on a questionnaire design with a random sampling which is stratified depending on educational level and province.

E N D
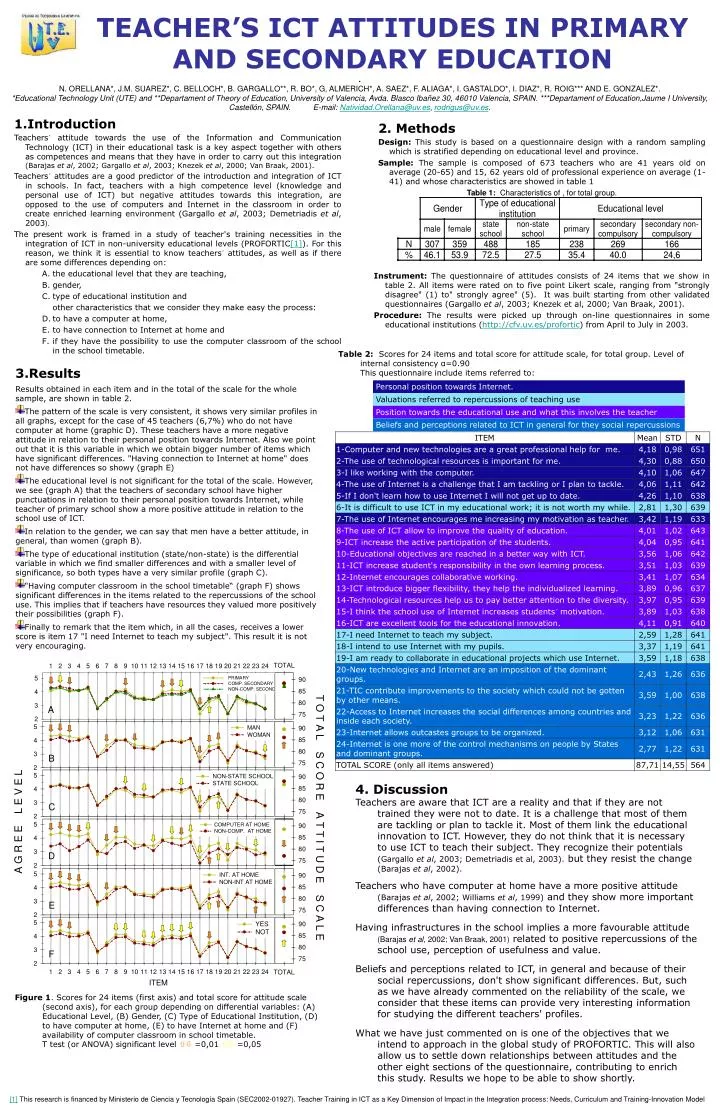
Table 2. Summary of Results. 2. Methods Design: This study is based on a questionnaire design with a random sampling which is stratified depending on educational level and province. Sample: The sample is composed of 673 teachers who are 41 years old on average (20-65) and 15, 62 years old of professional experience on average (1-41) and whose characteristics are showed in table 1 Table 1: Characteristics of , for total group. Instrument: The questionnaire of attitudes consists of 24 items that we show in table 2. All items were rated on to five point Likert scale, ranging from "strongly disagree" (1) to" strongly agree" (5). It was built starting from other validated questionnaires (Gargallo et al, 2003; Knezek et al, 2000; Van Braak, 2001). Procedure: The results were picked up through on-line questionnaires in some educational institutions (http://cfv.uv.es/profortic) from April to July in 2003. A B C D E F Figure 1. Scores for 24 items (first axis) and total score for attitude scale (second axis), for each group depending on differential variables: (A) Educational Level, (B) Gender, (C) Type of Educational Institution, (D) to have computer at home, (E) to have Internet at home and (F) availability of computer classroom in school timetable. T test (or ANOVA) significant level =0,01 =0,05 TEACHER’S ICT ATTITUDES IN PRIMARY AND SECONDARY EDUCATION . N. ORELLANA*, J.M. SUAREZ*, C. BELLOCH*, B. GARGALLO**, R. BO*, G, ALMERICH*, A. SAEZ*, F. ALIAGA*, I. GASTALDO*, I. DIAZ*, R. ROIG*** AND E. GONZALEZ*. *Educational Technology Unit (UTE) and **Departament of Theory of Education, University of Valencia, Avda. Blasco Ibañez 30, 46010 Valencia, SPAIN. ***Departament of Education,Jaume I University, Castellón, SPAIN. E-mail: Natividad.Orellana@uv.es, rodrigus@uv.es. • Introduction • Teachers´ attitude towards the use of the Information and Communication Technology (ICT) in their educational task is a key aspect together with others as competences and means that they have in order to carry out this integration (Barajas et al, 2002; Gargallo et al, 2003; Knezek et al, 2000; Van Braak, 2001). • Teachers´ attitudes are a good predictor of the introduction and integration of ICT in schools. In fact, teachers with a high competence level (knowledge and personal use of ICT) but negative attitudes towards this integration, are opposed to the use of computers and Internet in the classroom in order to create enriched learning environment (Gargallo et al, 2003; Demetriadis et al, 2003). • The present work is framed in a study of teacher's training necessities in the integration of ICT in non-university educational levels (PROFORTIC[1]). For this reason, we think it is essential to know teachers´ attitudes, as well as if there are some differences depending on: • the educational level that they are teaching, • gender, • type of educational institution and • other characteristics that we consider they make easy the process: • to have a computer at home, • to have connection to Internet at home and • if they have the possibility to use the computer classroom of the school in the school timetable. Table 2: Scores for 24 items and total score for attitude scale, for total group. Level of internal consistency α=0.90 This questionnaire include items referred to: • 3.Results • Results obtained in each item and in the total of the scale for the whole sample, are shown in table 2. • The pattern of the scale is very consistent, it shows very similar profiles in all graphs, except for the case of 45 teachers (6,7%) who do not have computer at home (graphic D). These teachers have a more negative attitude in relation to their personal position towards Internet. Also we point out that it is this variable in which we obtain bigger number of items which have significant differences. "Having connection to Internet at home" does not have differences so showy (graph E) • The educational level is not significant for the total of the scale. However, we see (graph A) that the teachers of secondary school have higher punctuations in relation to their personal position towards Internet, while teacher of primary school show a more positive attitude in relation to the school use of ICT. • In relation to the gender, we can say that men have a better attitude, in general, than women (graph B). • The type of educational institution (state/non-state) is the differential variable in which we find smaller differences and with a smaller level of significance, so both types have a very similar profile (graph C). • "Having computer classroom in the school timetable“ (graph F) shows significant differences in the items related to the repercussions of the school use. This implies that if teachers have resources they valued more positively their possibilities (graph F). • Finally to remark that the item which, in all the cases, receives a lower score is item 17 "I need Internet to teach my subject". This result it is not very encouraging. 4. Discussion Teachers are aware that ICT are a reality and that if they are not trained they were not to date. It is a challenge that most of them are tackling or plan to tackle it. Most of them link the educational innovation to ICT. However, they do not think that it is necessary to use ICT to teach their subject. They recognize their potentials (Gargallo et al, 2003; Demetriadis et al, 2003). but they resist the change (Barajas et al, 2002). Teachers who have computer at home have a more positive attitude (Barajas et al, 2002; Williams et al, 1999) and they show more important differences than having connection to Internet. Having infrastructures in the school implies a more favourable attitude (Barajas et al, 2002; Van Braak, 2001) related to positive repercussions of the school use, perception of usefulness and value. Beliefs and perceptions related to ICT, in general and because of their social repercussions, don't show significant differences. But, such as we have already commented on the reliability of the scale, we consider that these items can provide very interesting information for studying the different teachers' profiles. What we have just commented on is one of the objectives that we intend to approach in the global study of PROFORTIC. This will also allow us to settle down relationships between attitudes and the other eight sections of the questionnaire, contributing to enrich this study. Results we hope to be able to show shortly. [1]This research is financed by Ministerio de Ciencia y Tecnología Spain (SEC2002-01927). Teacher Training in ICT as a Key Dimension of Impact in the Integration process: Needs, Curriculum and Training-Innovation Model