Download
1 / 10
100 likes | 211 Views
Validation of TES version 2 ozone profiles. Ray Nassar, Jennifer A. Logan, Helen M. Worden and Inna A. Megretskaia Aura Science Team Meeting, NCAR, Boulder, 2006 September 11-15. World Ozone and Ultraviolet Data Center (WOUDC) and Southern Hemisphere Additional Ozonesonde (SHADOZ) Archive.

E N D
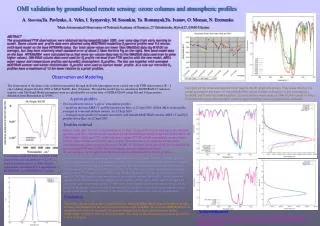
Validation of TES version 2 ozone profiles Ray Nassar, Jennifer A. Logan, Helen M. Worden and Inna A. Megretskaia Aura Science Team Meeting, NCAR, Boulder, 2006 September 11-15
World Ozone and Ultraviolet Data Center (WOUDC) and Southern Hemisphere Additional Ozonesonde (SHADOZ) Archive Total: 143 coincidences Coincidence criteria = 200 km radius, 48 hours Ray Nassar Aura Science Team Meeting, NCAR, 2006 September 12
Applying the TES Averaging Kernel and Constraint Version 002 R2971_Seq0100_Scn003 Hohenpeissenberg (48N, 11W) 2005-07-18 Ray Nassar Aura Science Team Meeting, NCAR, 2006 September 12
TES Temperature and Ozone: 3 Latitude Zones Green – Northern midlatitudes (35-52ºN) Red – Tropics (26ºS-26ºN) Blue – Antarctic (69-71ºS) Ray Nassar Aura Science Team Meeting, NCAR, 2006 September 12
TES-sonde ozone differences in 3 latitudes zones N = 20 N = 18 N = 47 Ray Nassar Aura Science Team Meeting, NCAR, 2006 September 12
TES vs. sonde ozone upper troposphere (UT) and lower troposphere (LT) average correlations in 3 latitudes zones Version 001 bias = 9.8 RMS = 10.3 N = 16 Version 001 bias = 16.8 RMS = 18.9 N = 27 Version 001 bias = -2.6 RMS = 6.7 N = 24 Version 001 bias = -7.36 RMS = 7.01 N = 16 LT (surface - 500 hPa) and UT (500 hPa - 200 hPa or tropopause, whichever is larger) Ray Nassar Aura Science Team Meeting, NCAR, 2006 September 12
Coincidence Criteria, Outliers, Back Trajectories Removed TES data based on qflag=0 (41) or emission layer (3) Removed coincidence pairs based on |DT| > 5 K (14) for multiple levels 68 km, 3.4 hrs, |DT| < 5 K over all levels 191 km, 24.9 hrs |DT| > 5 K over multiple levels sonde Hohenpeissenberg, Germany TES R2971_Seq0100_Scn003 sonde Legionowa, Poland TES R2328_Seq0692_Scn002 HYSPLIT HYbrid Single-Particle Lagrangian Integrated Trajectory Model access via NOAA ARL READY Website: http://www.arl.noaa.gov/ready/hysplit4.html Ray Nassar Aura Science Team Meeting, NCAR, 2006 September 12
DJF – blue MAM – green JJA – red SON - black Reunion (6) Irene/Pretoria (4) Naha (2) Paramaribo (1) Tropical Variability Difficult to examine seasonal variability in other latitude zones because of low number of coincidences per season. Tropics contain the largest source of tropospheric ozone (biomass burning). N = 47 Ray Nassar Aura Science Team Meeting, NCAR, 2006 September 12
Tropics (10ºS-10ºN) and Subtropics (20-26ºS/N) Red (10ºS-10ºN) Gray + black dashed (26ºS-26ºN) Ray Nassar Aura Science Team Meeting, NCAR, 2006 September 12
Conclusions • TES nadir ozone profiles are typically biased high in all three latitude zones, but this bias has been reduced from that determined in Worden et al. (2006) for V01 • The current absolute bias is higher between 10-100 hPa, but the % bias is higher for lower altitudes • Mean DO3 (TES-sonde) % from the surface to 200 hPa are: Northern midlatitude: 4-17%, Tropical: -5-14%, Antarctic: 0-27% • The main exception to the high bias in ozone occurs in the subtropics between ~100-300 hPa • The RMS or variability in the DO3 was highest in the Northern midlatitude UT and lowest in the Antarctic LT • The biases and variability characterized here should be considered in any scientific studies using TES ozone data • The availability of more coincidences would be valuable in further characterizing the TES ozone biases and variability Ray Nassar Aura Science Team Meeting, NCAR, 2006 September 12