Download
1 / 12
120 likes | 302 Views
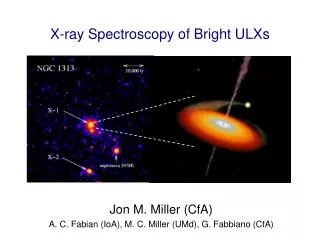
Time resolved X-ray spectroscopy of NGC 4051. Katrien C. Steenbrugge St John’s College, University of Oxford Marjan Fenovic, Elisa Costantini, Jelle Kaastra (SRON) and Frank Verbunt (SIU). NCG 4051. Narrow line Seyfert 1 X-ray bright Variable X-ray flux.

E N D
Time resolved X-ray spectroscopy of NGC 4051 Katrien C. Steenbrugge St John’s College, University of Oxford Marjan Fenovic, Elisa Costantini, Jelle Kaastra (SRON) and Frank Verbunt (SIU)
NCG 4051 • Narrow line Seyfert 1 • X-ray bright • Variable X-ray flux. • Distance of 18.6 Mpc (Tully & Pierce 2000). Observations I discuss: • LETGS 01 Jan. 2002 for 94 ks. • LETGS 23 July 2003 for 96 ks.
X-ray spectroscopy • Possibility to detect variation in the absorber properties with changing flux. • If ionization changes with flux, then the density of the outflow can be calculated. • Hence, the distance of the absorber, the energy density and mass outflow can be calculated.
X-ray lightcurve The flux decreases by a factor of 5 just before D. Spectra were extracted for periods A, B, C and D.
X-ray continua Between spectrum C and D, power-law photon index, becomes softer. Temperature of black body decreases.
X-ray spectra • The spectra are of rather low signal to noise. • Spectrum C: 4 absorption components are necessary: log ξ = 0.07-3.19. • Spectrum D: RRC of C V and C VI.
Radiative Recombination Continua • Using emission measure, temperature and maximum broadening, a BH mass of 3x10⁵ Msun and luminosity we derive a column density that is similar to the highest ionized absorber: ~1026 m-2. • However, the ionization parameter log ξ~ 1.6 is much lower than that of the highest ionized absorber. RRC’s might be from the accretion disk.
Absorbers • None of the 4 ionization parameters does react linearly to the decrease in flux by a factor of 5 between spectra C and D. • One ionization parameter shows a 2.3σ change from logξ = 0.87 to 0.52 between spectrum C and D. • The other 3 ionization parameters change less than 1σ between spectrum A, B, C and D.
Long term spectral results • The column densities we measure are consistent as those measured from RGS spectrum (Ogle et al. 2004) except logξ > 3. • The highest ionized absorber in our spectrum has the largest outflow velocity: 4670 km/s. • HETG spectrum: the highest ionized absorber has the highest outflow velocity: 2340 km/s (Collinge et al. 2001). • We do not detect a 2340 km/s absorber. This component is variable on years timescale.
Broad emission lines • We detect broadened emission lines from C VI and O VII. • C VI FWHM is ~2000 km/s, similar to the with of Hβ. • O VII triplet FWHM is ~11000 km/s broader than the He II line of ~5000 km/s. There is an ionization gradient in the broad line region.
Relativistic O VIIILyα line • Detected in spectra A, B and C. • Inclination angle is the same as found from XMM (Ogle et al. 2004) and for the narrow line region (Christopoulou et al. 1997).
Conclusions • The spectrum has multiple components! • The continuum shape does change with flux. • In spectrum D we detect C V, C VI RRC. • There are broad C VI and O VII, and relativistic O VIII Lyα lines present. • The highest outflow component is variable on timescales of years.