Download
1 / 11
110 likes | 308 Views
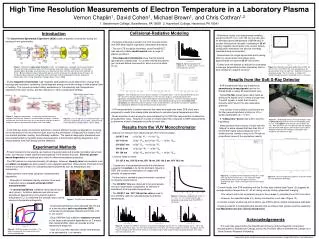
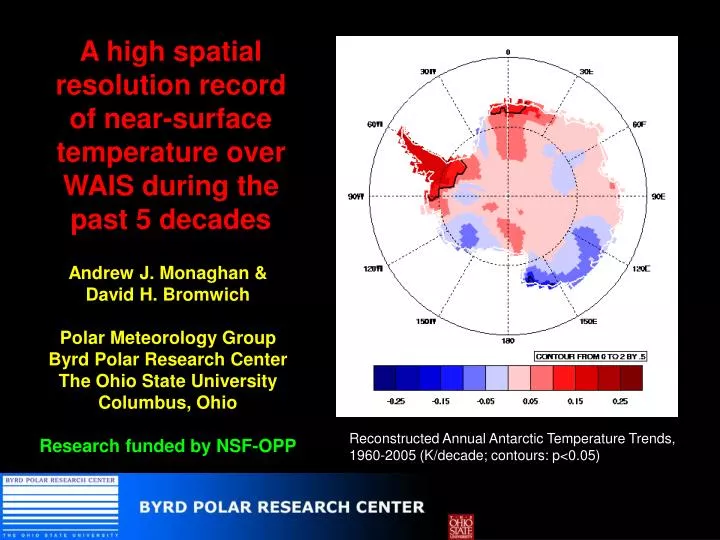
A high spatial resolution record of near-surface temperature over WAIS during the past 5 decades. Andrew J. Monaghan & David H. Bromwich Polar Meteorology Group Byrd Polar Research Center The Ohio State University Columbus, Ohio Research funded by NSF-OPP.

E N D
A high spatial resolution record of near-surface temperature over WAIS during the past 5 decades Andrew J. Monaghan & David H. Bromwich Polar Meteorology Group Byrd Polar Research Center The Ohio State University Columbus, Ohio Research funded by NSF-OPP Reconstructed Annual Antarctic Temperature Trends, 1960-2005 (K/decade; contours: p<0.05)
Motivation and Methodology (1) • There is a need to understand the decadal variability of snowfall and temperature over all of Antarctica in order to: • put recent satellite-derived mass balance and temperature trends into perspective • Understand Antarctica’s role in global sea level rise • Provide a long-term record of snowfall and temperature for GCM assessment • Last year at WAIS we presented a record of Antarctic accumulation variability from several numerical models from 1985-2001. • Result: No statistically significant change in snowfall since 1985. • Problem: Model records are not reliable before ~1980. We need a longer record. Snowfall trends, 1985-2001 (% decade-1) Monaghan et al. (PTRS-A, 2006)
Motivation and Methodology (2) • Many new ice core accumulation records have emerged as a result of the International Transantarctic Scientific Expedition (ITASE). • By blending the ice core data with model records, we were able to reconstruct a robust snowfall record back to the IGY (results shown in next slide) Spatial correlation of annual snowfall variability at 16 ice core and/or human-observation locations (yellow dots) with long-term records. (red colors: p<0.05) Monaghan et al. (Science, 2006)
Antarctic Snowfall Trends since the IGY Trends offsetting in space and time. Considerable annual and decadal variability No statistically-significant trend over the 50-year record Monaghan et al. (Science, 2006)
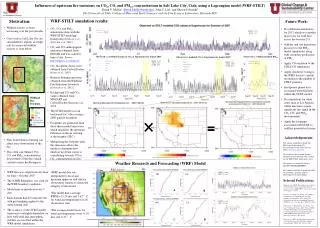
The Next Step: • Using the same methodology, here we reconstruct a temperature record back to 1960 using station data (from READER and NSIDC). The advantage of this technique is that it has spatial, in addition to temporal, resolution. Therefore, we can look at regional changes at monthly and annual scales. Spatial correlation of annual near-surface temperature variability at 15 Antarctic stations (yellow dots) with long-term records. (red colors: p<0.05)
Antarctic Temperature Reconstruction: Comparing Annual Time Series Method Captures variability with good skill. Model variability slightly large? Our reconstruction closely matches that of Schneider et al. (GRL, 2006).
Antarctic Temperature Reconstruction: Comparing Spatial Trends, 1969-2000 Chapman and Walsh (2005) OUR METHOD (K/decade) (contours: p<0.05) KRIGED-Total Change (K) From Station records Trends match closely, but ours don’t have ‘kriged’ appearance Note: We still have a ways to go in validating these temperature records. Thus, the subsequent results are preliminary.
Antarctic Temperature Reconstruction: Comparing Annual Trends (K/decade) over various periods (black contours: p<0.05) 1960-2005 1969-2000 1980-2001 Trends over continent are strongly dependent on time period. Is recent change related to decadal variability?
Antarctic Temperature Reconstruction: Comparing monthly trends (K/decade) 1969-2000 DEC JAN FEB MAR APR MAY JUN JUL AUG SEP OCT NOV Summer, Autumn cooling related to strengthening of SAM Winter surface warming consistent with tropospheric warming from Turner et al. (Science, 2006).
Sensitivity of Antarctic Annual Accumulation to Temperature The extended snowfall and temperature records indicate an approximate 5%/K snowfall sensitivity to Antarctic temperature This is consistent with AOGCM estimates from Huybrechts et al. (GPC, 2004) Relationship is not robust for SH and global temps
Summary: Recent trends • Yearly and decadal snowfall and temperature variability is very large. It is critical to establish longer records from the extremely valuable satellite measurements of dH/dt, gravity fluctuations, temperature, and other parameters so that trends can be distinguished from the high background variability. • There have been no statistically significant trends in Antarctic snowfall or temperature (except the Peninsula) over the past 50-years. Sea level rise has not been offset by recently increased Antarctic snowfall, despite strong winter warming over Antarctica and year-round warming throughout the rest of the Southern Hemisphere. • These preliminary results suggest that the sensitivity of Antarctic snowfall to regional temperature changes is consistent with GCM estimates of ~5%/K. However, the linkage with the temperature behavior over Antarctica is complex and arises because of changes in the atmospheric circulation. • If Antarctic temperature changes become consistent with the rest of the globe in coming decades, as GCMs predict (due in part to the healing of the ozone hole), a rise in Antarctic snowfall is possible. • LOTS OF MODEL OUTPUT AVAILABLE: http://polarmet.mps.ohio-state.edu