Download
1 / 14
140 likes | 529 Views
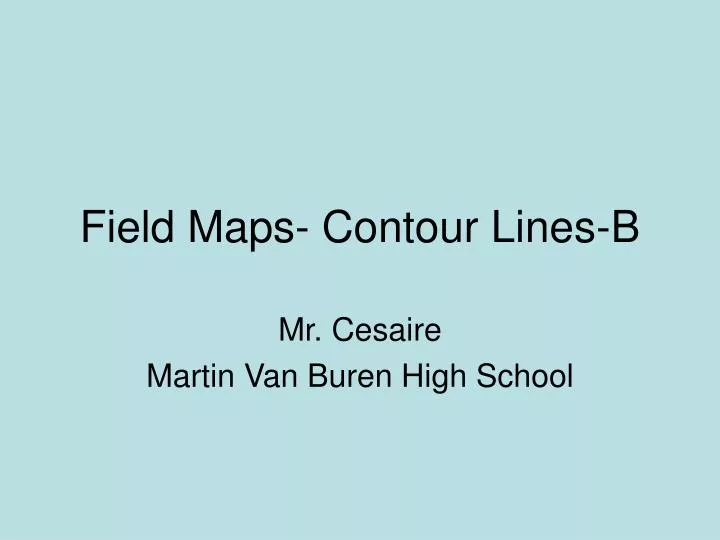
Field Maps- Contour Lines-B. Mr. Cesaire Martin Van Buren High School. Aim: What types of information can we learn from field maps. Do Now: Read page 15-16 Ans 28 to 30 from the green review book in the back. HW Read pages 32 to 35. Answer questions 1to 10.

E N D
Field Maps- Contour Lines-B Mr. Cesaire Martin Van Buren High School
Aim: What types of information can we learn from field maps. • Do Now: Read page 15-16 Ans 28 to 30 from the green review book in the back. • HW Read pages 32 to 35. Answer questions 1to 10. • Our Final is on Wednesday October 8th. • Marking Period ends October 10th.
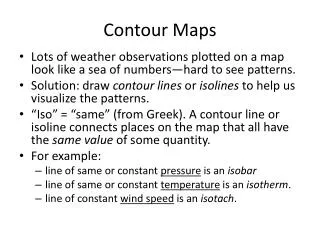
Field Maps • Field maps are maps that give the user useful information about: • Temperature • Elevation • Concentration (Waste spills) • Flow (ground water flow) Just about any type of data can be presented on field map.
Field Lines • Numerical data of equal value (Temperature, Elevation, Concentration) on a field map are connected. • Isolines- Lines that connect points of equal value on a field map.
Isotherms http://earth.usc.edu/~stott/Catalina/tempdistribution.html • Isotherms- Lines that connect points of equal temperature.
http://earth.usc.edu/~stott/Catalina/tempdistribution.html Isotherms
http://earth.usc.edu/~stott/Catalina/tempdistribution.html Isotherms
Isobars Isobars- Lines that connect points of equal value of air pressure. http://geography.sierra.cc.ca.us/booth/Physical/chp5_atm_pressure/pressure_gradient.jpg
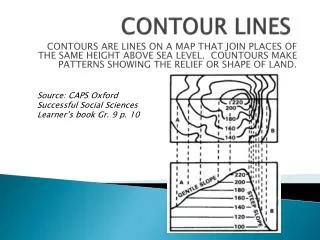
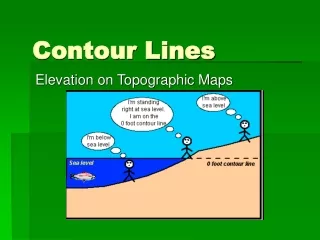
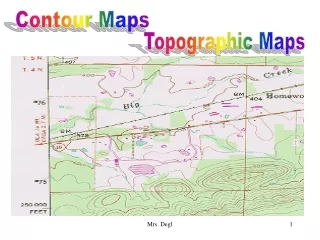
Contour Lines • Contour Lines- lines that connect points of equal elevation. http://academic.brooklyn.cuny.edu/geology/leveson/core/linksa/contourlabel.html
Contouring • In order to connect points of equal value, you need to choose an interval. • Interval- the space between two points or values. • Intervals on maps can go by 10s, 20s, 50s, 100s, 1000s, 10,000s
Drawing Contour Lines • Interval = 10 40 The contour values were 40, 50, and 60. These three values were not on the grid. But we drew contour lines that estimated where they could be found. 50 60