Download
1 / 48
570 likes | 2.26k Views
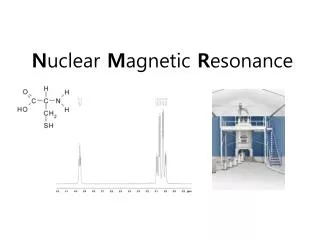
N uclear M agnetic R esonance Spectroscopy. The nuclei of interest are primarily hydrogen and carbon 1 H NMR also called PMR 13 C NMR also called CMR. The Basis of NMR. NMR Active and Non-active Nuclei. Spinning proton resembles a tiny magnet. Protons in a magnetic field.

E N D
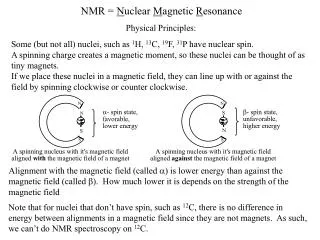
Nuclear Magnetic Resonance Spectroscopy The nuclei of interest are primarily hydrogen and carbon 1H NMR also called PMR 13C NMR also called CMR
The size of the magnet determines energy difference between spin states
Magnetic Shielding by Electrons • The naked proton will come into resonance with a specific combination of radio energy and magnetic field strength. • But real protons are surrounded by electrons • Circulating electrons generate a small induced magnetic field that opposes the external magnetic field (B external) – (B induced) = B effective
Chemical shift- position on the x-axis determined by shielding
NMR Information 1H NMR spectrum contains 3 pieces of information: 1. 2. 3.
2. Integration of PeaksThe red curves represent the peak areas ( integration)
3. Peak SplittingThe (n+1) rule indicates the number of protons attached to neighboring carbon atoms A singlet indicates there are no protons on adjacent carbon atom A triplet indicates there are 2 protons on adjacent carbon atom
Chemical Shift due to electron withdrawing effect triplet and quartet = ethyl pattern
Chemical Shift for two Isomeric Esters: C4H8O2 The signals for both spectra are the same: a singlet, triplet & quartet.
Splitting Patterns: n+1 Rule • A signal is split into multiple peaks by adjacent protons • The signal is split into n+1 peaks, where n = the number of equivalent adjacent protons
Reciprocity of Coupling Constants • The distance between peaks of a multiplet are called coupling constants or J values
Interpreting Spectra • Look for diagnostic chemical shifts • Look for relative ratios (integration) • Analyze splitting patterns • Consult Tables of chemical shifts and Tables of coupling constants (J values)
methyl propionate C4H8O2
isopropanol C3H8O
ethyl vinyl ether C4H8O