Download
1 / 8
90 likes | 244 Views
Two-way Frequency Tables. S.ID.5. There are essentially two types of data: Q uantitative and C ategorical . Examples of categorical data: color, type of pet, gender, ethnic group, etc. Categorical Data is not numerical !

E N D
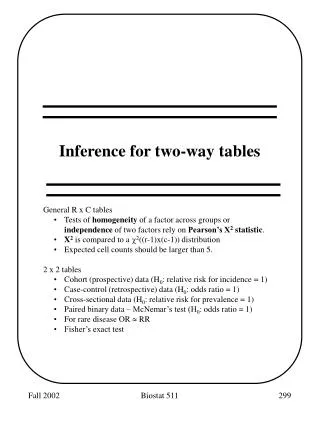
Two-way Frequency Tables S.ID.5
There are essentially two types of data: Quantitative and Categorical. • Examples of categorical data: color, type of pet, gender, ethnic group, etc. • Categorical Data is not numerical! • Examples of quantitative data: age, years of schooling, height, weight, test score, etc. • Quantitative Data is numerical!
More aboutQuantitative and Categorical data: • Categorical Data: • Graphs… Bar Graphs, Pie Charts • Statistics most often used… Frequencies • Quantitative Data: • Graphs… Box & Whisker, Dot Plots, Histograms • Statistics most often used… • Measures of Center (Mean, Median, Mode) • Measures of Spread (Range, IQR, MAD, Outliers) • Others that we have not yet learned
Bivariate data • Bivariate dataconsists of pairs of linked numerical observations, or frequencies of things in categories. • A bivariate or two-way frequency chartis often used with data from two categories.
Joint Frequencies • If no person or thing can be in more than one category per scale, the entries in each cell are called joint frequencies. • Joint Frequenciesare like your joints…in the middle…connected (each cell on the inside of the table).
Marginal Frequencies • Marginal Frequencies are the totals of each category • Marginal Frequenciesare in the MARGIN (the edge where the totals are).
Conditional Frequencies • Conditional Frequenciesare restricted to a particular group (or subgroup)…”given that.” They do not come from the total data, but from a row total or column total
Relative Frequencies • Relative Frequency is the absolute frequency normalized by the total number of events