Download

1 / 8
160 likes | 590 Views
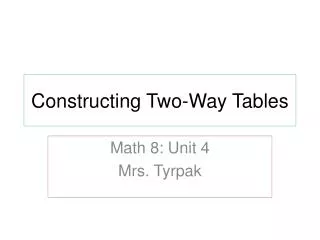
Two Way Tables . In June 6 people went to France, 18 went to Holland and 5 went elsewhere. In July 10 people went to France, 19 went to Holland and 2 went elsewhere. In August 15 people went to France, 15 people went to Holland and 10 went elsewhere. Two-Way Tables.

E N D
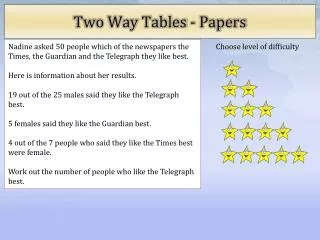
In June 6 people went to France, 18 went to Holland and 5 went elsewhere. In July 10 people went to France, 19 went to Holland and 2 went elsewhere. In August 15 people went to France, 15 people went to Holland and 10 went elsewhere. Two-Way Tables Two-way tables are useful for displaying data in a clear and concise form. The information given above becomes much clearer if it is placed in a two-way table. 6 18 5 29 10 19 2 31 15 15 10 40 31 52 17 100
Completing 1 1. How many people visited Holland in July? 2. How many people visited France in August? 3. How many people went on holiday in June? 4. How many people went to Holland? 5. How many people did not visit France or Holland? Use the information in the table to answer the following: 6 18 5 29 10 19 2 31 15 15 10 40 31 52 17 100 19 15 29 52 17
Completing 2 80 people were asked which one of three TV Channels they preferred to watch. Complete the partially filled two-way table below. 5 60 20 20 27 33
Completing 3 Some college students were asked to choose which of the three subjects, English, maths or science they enjoyed most. Complete the two-table below. 17 23 18 56 28 106
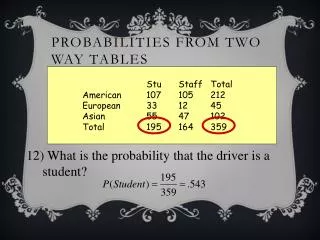
Probability 1 1. Went to Holland on holiday? 2. Went on holiday in July? 3. Went to France in August? 4. Did not visit either France or Holland? 5. Went on holiday in June? You can use two-way tables to help solve probability problems: 6 18 5 29 10 19 2 31 15 15 10 40 31 52 17 100 What is the probability that a person selected at random: 52/100 31/100 15/100 17/100 29/100
Probability 2 1. Preferred BBC 1? 2. Preferred channel 4? 3. Was a male? 4. Was a female? 5. Was a male who preferred ITV? 80 people were asked which one of three TV Channels they preferred to watch. The results are given in the two-way table below. 5 60 20 20 27 33 What is the probability that a person selected at random: 20/80 27/80 20/80 60/80 5/80
Probability 3 1. Chose science as their favourite subject? 2. Chose English as their favourite subject? 3. Was a boy? 4. Was a girl who’s favourite subject was English? 5. Was a boy who’s favourite subject was maths? Some college students were asked to choose which of the three subjects, English, maths or science they enjoyed most. The information is displayed in the two-way table below. 17 23 18 56 28 106 What is the probability that a person selected at random: 40/106 38/106 56/106 20/106 15/106