Download
1 / 36
380 likes | 457 Views
Explore the latest developments in reconstruction algorithms for muon tomography, from the concept to implementation. Learn about the use of muons in imaging various materials and structures in fields like medical, biological, and cargo inspections. Discover the advantages of using muon tomography over traditional detection methods and the challenges faced in the reconstruction process.

E N D
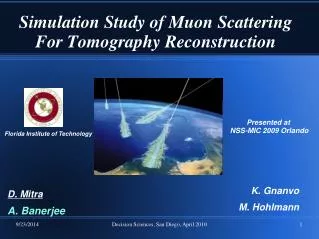
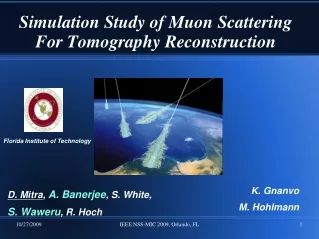
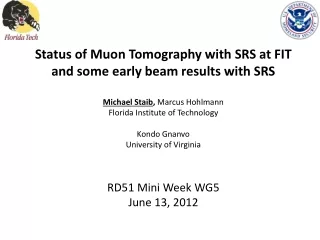
Advances in Reconstruction Algorithms for Muon Tomography • R. Hoch, M. Hohlmann, D. Mitra, K. Gnanvo
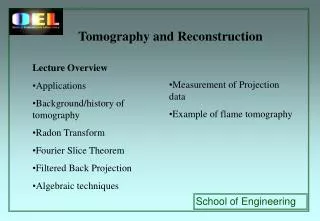
Tomography • Imaging by sections • Image different sides of a volume • Use reconstruction algorithms to combine 2D images into 3D • Used in many applications • Medical • Biological • Oceanography • Cargo Inspections?
Muons • Cosmic Ray Muons • More massive cousin of electron • Produced by cosmic ray decay • Sea level rate 1 per cm^2/min • Highly penetrating, but affected by Coulomb force
Previous Work • E.P George • Measured rock depth of a tunnel • Luis Alvarez • Imaged Pyramid of Cheops in search of hidden chambers • Nagamine • Mapped internal structures of volcanoes • Frlez • Tested efficiency of CsI crystals for calorimetry
Muon Tomography • Previous work imaged large structures using radiography • Not enough muon loss to image smaller containers • Use multiple coulomb scattering as main criteria
Why Muon Tomography? • Other ways to detect: • Gamma ray detectors (passive and active) • X-Rays • Manual search • Muon Tomography advantages: • Natural source of radiation • Less expensive and less dangerous • Decreased chance of human error • More probing i.e. tougher to shield against • Can detect non-radioactive materials • Potentially quicker searches
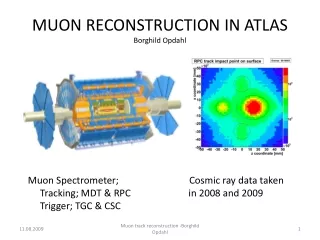
Computer Science Seminar Muon Detection • Drift tubes: • Low resolution • Proven technology • Gas Electron Multiplier • Higher resolution • A challenge is building a large detector array
Reconstruction Algorithms • Point of Closest Approach (POCA) • Geometry based • Estimate where muon scattered • Expectation Maximization (EM) • Developed at Los Alamos National Laboratory • More physics based • Uses more information than POCA • Estimate what type of material is in a given sub-volume
Reconstruction Concerns • Accuracy • No false negatives with low false positives • Exposure time needed • Goal is one minute • Computation time • POCA and EM have wildly different run times • Online Algorithm • Continuously updating algorithm
Simulations • Geant4 - simulates the passage of particles through matter • CRY – generates cosmic ray shower distributions
POCA Concept Incoming ray 3D POCA Emerging ray
POCA Result 40cmx40cmx20cm Blocks (Al, Fe, Pb, W, U) Unit: mm Θ U W Pb Fe Al
POCA Discussion • Pro’s • Fast and efficient • Can be updated continuously • Accurate for simple scenario’s • Con’s • Doesn’t use all available information • Unscattered tracks are useless • Breaks down for complex scenarios
Expectation Maximization • Explained in 1977 paper by Dempster, Laird and Rubin • Finds maximum likelihood estimates of parameters in probabilistic models using “hidden” data • Iteratively alternates between an Expectation (E) and Maximization (M) steps • E-Step computes an expectation of the log likelihood with respect to the current estimate of the distribution for the “hidden” data • M-Step computes the parameters which maximize the expected log likelihood found on the E step
EM Basis Scattering Angle Scattering function Distribution ~ Gaussian (Rossi)
EM Concept L T Voxels following POCA track
Algorithm • gather data: (ΔΘx, Δθy, Δx, Δy, pr^2) • estimate LT for all muon-tracks • initialize λ (small non-zero number) • for each iteration k=1 to I • for each muon-track i=1 to M • Compute Cij - E-Step • for each voxel j=1 to N M-Step • return λ
Implementation • One program coded in C • POCA and EM independent • Designed to make most efficient use of memory • Developed to facilitate easy testing of different parameters (config file) • Run on high performance computing cluster in HEP lab
EM Results 40cmx40cmx20cm U block centered at the origin Unit: mm z x y
EM Results 40cmx40cmx20cm Blocks (Al, Fe, Pb, W, U) 10cmx10cmx10cm Blocks (Al, Fe, Pb, W, U) Unit: mm Unit: mm U U W W Pb Fe Pb Fe z z Al Al x x y y
Median Method • Rare large scattering events cause the average correction value to be too big • Instead, use median as opposed to average • Significant computational and storage issues • Use binning to get an approximate median
EM Median Results 40cmx40cmx20cm U block centered at the origin Unit: mm z x y
EM Results 40cmx40cmx20cm Blocks (Al, Fe, Pb, W, U) Average Approximate Median Unit: mm Unit: mm U U W W Fe Pb Pb Fe z z Al Al x x y y
EM Median Results 40cmx40cmx20cm Blocks (Al, Fe, Pb, W, U) Average Approximate Median U U Fe W Pb Fe W Pb z (λ) Al z (λ) Al x (mm) x (mm) y (mm) y (mm)
EM Voxel Size Effects Unit: mm Unit: mm Fe Fe z z x y x y Unit: mm Unit: mm Fe Fe z z x y x y
EM Target Size Effects Unit: mm Unit: mm U U z z x y x y Unit: mm Unit: mm z z x y x y
LANL Scenario • New standard scenario • Detector Geometry 2mX2mX1.1m • 3 10cmx10cmx10cm Targets • W (-300mm, -300mm, 300mm) • Fe (0mm, 0mm, 0mm) • Al (300mm, 300mm, -300mm) • Only run with 5cmX5cmX5cm voxels W Fe Al
Standard Scenario Average Results Unit: mm W W z (λ) Fe z Al x (mm) x y y (mm)
Standard Scenario Median Results Unit: mm Al z (λ) z x (mm) y (mm) x y Fe W z (λ) z (λ) x (mm) x (mm) y (mm) y (mm)
Online EM • Unlike POCA, EM needs all data at once, preventing continuous updates • Use multi-threading to collect data and run EM in parallel • Experimentally find thresholds to determine when to transfer new data • Simulate: • Only process arbitrary number of events and run EM for a set number of iterations • Process more events, run EM and repeat until all events are used
POCA Biased EM • EM makes assumptions about “hidden” data • Weight this data based on location to voxel containing POCA • Total POCA – Voxels containing POCA 1, others 0 • Linear – Voxel containing POCA 1, others (POCA-voxel - current-voxel) / total-voxels-on-track • Others – Experiment to figure out distribution of hidden data
Current Work • Stabilize EM convergence and lambda values • Create and analyze correction value distributions • Some correction values very large or small and cause wild changes in lambda • Determine why these values are so large or small • Experiment with different parameters • Alter initial lambda value • Cut off large angles
Future Work • Improvement of lambda values/convergence • Online (Incremental) EM • Combination between EM and POCA • Analysis of complex scenarios
Who we are? Team @ PSS department: Dr. Marcus Hohlmann Dr. Kondo Gnanvo Patrcik Ford Ben Storch Judson Locke Xenia Fave Amilkar Segovia Nick Leioatts Team @ CS department: Dr. Debasis Mitra Richard Hoch Scott White Sammy Waweru Acknowledgement: Domestic Nuclear Detection Office of Department of Homeland Security Past Students: Jennifer Helsby, David Pena