1 / 30

Chapter 2 Descriptive Statistics: Tabular and Graphical Presentations Part B

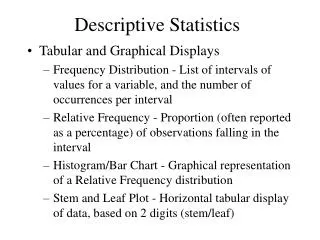
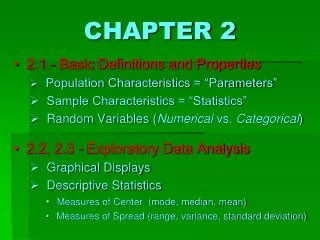
Exploratory Data Analysis. . . The techniques of exploratory data analysis consist of simple arithmetic and easy-to-draw pictures that can be used to summarize data quickly.. One such technique is the stem-and-leaf display.. Stem-and-Leaf Display. Each digit on a stem is a leaf.

benjy
Download Presentation

Chapter 2 Descriptive Statistics: Tabular and Graphical Presentations Part B

An Image/Link below is provided (as is) to download presentation Download Policy: Content on the Website is provided to you AS IS for your information and personal use and may not be sold / licensed / shared on other websites without getting consent from its author. Content is provided to you AS IS for your information and personal use only. Download presentation by click this link. While downloading, if for some reason you are not able to download a presentation, the publisher may have deleted the file from their server. During download, if you can't get a presentation, the file might be deleted by the publisher.

E N D

Presentation Transcript


    More Related