Download
1 / 30
300 likes | 430 Views
Preliminary Findings comparative organizational analysis of 11 local health departments. Jacqueline Merrill Biomedical Informatics Columbia University AcademyHealth PHSR-IG June 7, 2008. Overview. Sample Framework and data PH Work

E N D
Preliminary Findingscomparative organizational analysis of 11 local health departments Jacqueline Merrill Biomedical Informatics Columbia University AcademyHealth PHSR-IG June 7, 2008
Overview • Sample • Framework and data • PH Work • Preliminary correlations between network and performance
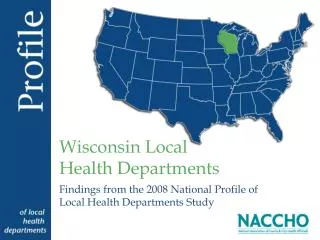
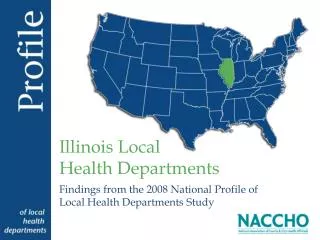
Sample • National sample 11 local health departments • 3 mixed • 2 centralized • 5 independent • All but one served a designated “metro” area • Persons/sq. mile: 6 (AZ) – 526 (NJ) • Site selection • Size 36 – 186 employees • Latest date of NPHPS assessment and score • Willingness • Response rate 86 – 93%
AGE ALL ENVIRONMENTAL NURSE
Data we collected — ‘the organization’ • Employee x Employee Information Exchange/Communication network • Employee x Task = 44 tasks done for routine work 22 administrative tasks and 22 service tasks • Employee x Knowledge = 53 knowledge “better than avg” 15 administrative, 22 program and policy, 6 analytic, 7 PH science • Employee x Resource = 54 resources adequate or not 18 general, 9 data and information, 15 documents, 12 outside partners
Task Knowledge Resource Minimum Data Set Terms extracted from accreditation & evaluation instruments workforce surveys competency sets operational definition PH business processes
Network measurements • Centralization Hierarchy, decisions, dissemination • Density Communication, cohesion • Complexity Integration of organizational components • Between group (divisions) density “silos” FOUND A TWO MODE NETWORK STRUCTURE
Left Divisions strongest Density .24 Centralization .29 Right Divisions all ties Density .11 Centralization .52
Left Divisions strongest Density .08 Centralization .06Right Divisions all ties Density .19 Centralization .52
Strongest CORRELATIONS w/ Essential Service 4 ES 4 Mobilize community partnerships and action to identify and solve health problems Indicator 4.1 Identify key constituents; encourage participation in community health activities; maintain directory of community health organizations Indicator 4.2 Establish community partnerships; local health improvement committee; assess effectiveness of partnerships
Correlation coefficients comparing network measures in 10 local health departments Pink = correlation ≥ 0.7 Yellow = correlation ≥ 0.5
COCONINO Density .16 136 nodes Champaign Density .24 115 nodes Broome Density .19 122 nodes Missoula Density .21 106 nodes
Orange* Density .24 165 nodes Putnam* Density .27 97 nodes Garland Density .53 42 nodes Burlington Density .16 138 nodes Champaign Density .24 115 nodes StLucie Density .28 187 nodes StJohn Density .31 115 nodes Broome Density .19 122 nodes Missoula Density .21 106 nodes
Management effects“It has changed the way we think about the organization” • COMMUNICATION--monthly all staff meeting, all staff emails, recognizing people, director reports at weekly meetings • Re-organize space • Hiring • Data sharing • Social initiatives
Ongoing • Complete database • Establish baselines • Multiple regression to explain between group variance • Non linear regression to explain variability in performance • Repeat study w/ one LHD to determine network effect of managerial change • Exploratory data analysis
What we asked • Information Exchange: Give/get work info • not routine • routine not frequent • routine & frequent • Knowledge: better than average • Resources: for routine work • relevant & available • relevant not available • not relevant • Tasks: • assigned • could fill in
Organizational network analysis • tool for understandingcomplexity • empirical, relational, non-linear • used for assessment & management decision support
Network findings • Correlations Performance general score with Density, complexity, centralization, block model density Performance factor scores with Density, complexity, centralization, block model density
PH Work Findings Top ten tkr backup and resources needed Mean median & mode on # of PHN Env & Admin staff Mean median mode age, years in PH Range # of prof, technicians, management & admin staff Pairwise correlations TKR between PHN and Env, PHN & admin, Env & admin