Download
1 / 17
170 likes | 281 Views
Wisconsin Local Health Departments. Findings from the 2008 National Profile of Local Health Departments Study. National Profile of Local Health Departments Study. The National Profile of Local Health Departments is a survey of local health department (LHD) infrastructure and activities

E N D
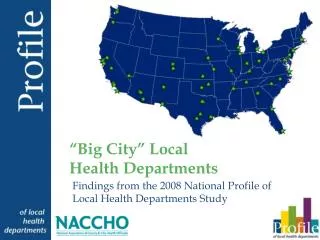
Wisconsin LocalHealth Departments Findings from the 2008 National Profile ofLocal Health Departments Study
National Profile of Local Health Departments Study • The National Profile of Local Health Departments is a survey of local health department (LHD) infrastructure and activities • NACCHO sends the Profile questionnaire to every LHD in the U.S. • Completed by 83% of all LHDs • Completed by 93% of Wisconsin LHDs • Data are self-reported by LHDs and not independently verified by NACCHO • Source of all data in this presentation
Wisconsin Local Health Departments • 88 Local Health Departments • Most LHDs (75%) serve county or combined city-county jurisdictions • 17% LHDs city jurisdictions • Nearly all Wisconsin LHDs (98%) have a Local Board of Health
Percentage of LHDsEmploying Selected Occupations Nurse Manager/Director Clerical Staff Environmental HealthSpecialist (Sanitarian) Nutritionist Health Educator Emergency Preparedness Coordinator Other Environmental Health Scientist Epidemiologist Physician Behavioral Health Professional Information Systems Specialist Public Information Specialist
“Typical” Staffing Patternsfor Wisconsin LHDsMedian Full-Time Equivalents (FTEs)for Selected Population Sizes
Median FTEs for All Staffand Selected Occupationsby Size of Population Served
Activities & ServicesProvided More Frequently in Wisconsincompared Nationally
Activities & ServicesProvided LessFrequently in Wisconsincompared Nationally
Community Health Assessmentand Improvement Planin past three years
For more information[insert contact info here] The 2008 Profile was made possible through funding from theCenters for Disease Control and Prevention and the Robert Wood Johnson Foundation.