Download

1 / 94
950 likes | 1.19k Views
Electrofishing Efficiency and Sampling Design 6. Session Purpose. The primary purpose of this module is to help biologists increase the accuracy and precision of sampling by 1 . improving efficiency of capture, and 2 . using a well-planned sampling design .

E N D
Session Purpose The primary purpose of this module is to help biologists increase the accuracy and precision of samplingby 1. improving efficiency of capture, and 2. using a well-planned sampling design. • Sampling design includes standardization (controlling important efficiency factors), optimizing sample unit number and location, and refining monitoring variables (should you use an index as CPUE or a population estimate?). • We also will use some simple models to investigate the implications of capture probability and sampling variance,number and placement of sampling units, and fish population characteristics on our decision to monitor abundance by CPUE alone or by using population estimates instead.
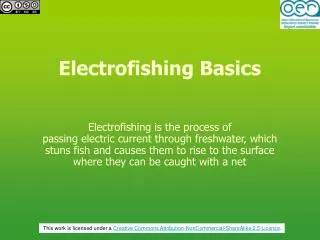
First, A Couple Concepts • Definition of capture efficiency • The Catch Equation
Definition of Capture Efficiency Proportion of population captured by a particular sampling gear and 1 unit of effort Example: N = 1000 fish* Captured = 150 fish Efficiency = 15% *Population size usually estimated by capture-recapture, depletion sampling, or total recovery (rotenone, draining)
Capture Efficiency (“q”) and Capture Probability (“p”) C=N*q*E C=N*p p=q*E where, N = true number of fish in a sample area C = number of individuals captured in a sample area q = capture efficiency E= effort (e.g., proportion of sample area fished) p= capture probability
Area (A) containing the population total population (N) Area Sampled (a) Catch =N*q*E =N*q*(a/A) N = Catch/(q*E) N = Catch/(q*(a/A))
Area (A) containing the population total population (N) Area Sampled (a) Catch =N*q*E =N*q*(2*a/A) N = Catch/(q*E) N = Catch/(q*(2*a/A))
Area (A) containing the population total population (N) Area Sampled (A) Catch =N*q*E =N*q*(A/A) =N*q or N = Catch/q Effort =1 so p=q If you sample all of A, then capture probability (p) equals efficiency (q)
Improving Efficiency of Capture • A strong approach is outlined in Framework for Increasing Sampling Efficiency and Precision of a Species • This outline incorporates much of what has been learned to this point in the course. • This protocol combines field and lab work to identify most effective electrical waveforms and electrode designs. Derived power standardization tables are coupled with equipment power analysis.
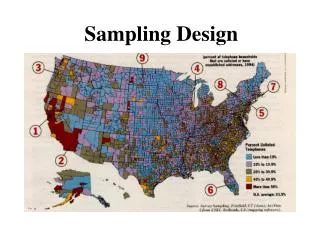
Sampling Design • Sampling design is about reducing bias and increasing accuracy and precision • i.e., results in estimation of a population parameter (as abundance) that is likely representative and has narrow confidence intervals • This function is accomplish by • where and how much to sample • standardization • refining the variables monitored
Sampling Design • Where and how much to sample • Three common frameworks: simple random sampling (SRS), stratified random sampling (STRS), and systematic sampling (SYS). • (There are others as adaptive cluster sampling, etc.)
Sampling Design • NOTE: calculation of parameter estimates as total abundance, means, and confidence intervals depends upon the sampling design. • For a tool to learn about these 3 common designs and to use for analysis of your data, see • Sampling Design Analysis
Sampling Design • Another tool to learn about how sample size, capture probability, and target fish population size influences point estimates and confidence intervals of catch-per-unit-effort , see • CPUE Analysis Planner
Sampling Design • For a slightly different purpose of estimating the ability to detect rare species, again with considerations of sample size, capture probability, and target fish population size, see • Detection Probability
Sampling Design • Standardization • Standardization is a set of approaches to control the influence of important efficiency factors.
Sampling Design • We have theoretical and empirical basis to approach controlling the effects of water conductivity (“power standardization”) • The influence of other efficiency factors identified as important for certain water bodies can be addressed by • Sampling only above, below, or within a range of values (as only sample when water temperature is above a particular reading) • Incorporate into efficiency equations for adjusting catch to a population estimate (this is not a way of standardization within a sampling design and will be discussed later in this module).
Sampling Design • The following section is a in-depth view of potential efficiency factors and how the sampling variation introduced by these factors can be minimized by standardization.
Three Categories of Efficiency Factors Biological Environmental Technical
Biological Factors • Fish factors • Size • Habitat preference • Behavior • Population size or density • Effective conductivity
Biological Factors More efficient with larger-sized fish Several studies have shown greater proportion of larger-sized individuals in a population are captured (higher q) by EF. Capture efficiency models often have fish length as a factor.
Study on Size-based Efficiency Efficiency of electrofishing as a function of total length for largemouth bass in 27 ponds. Primary sampling by boat electrofishing one lap of shoreline. Secondary sampling by rotenone. Reynolds & Simpson (1978) AFS Spec Pub #5.
Biological Factors Less power needed per fish volume with larger-sized fish Also, the main factor in susceptibility to electroshock was size (volume or length) Dolan & Miranda 2003
Power vs. Fish Length Pt.95 = 95% probability power threshold for immobilization Dolan and Miranda (2003)
Power vs Fish Length Pt.95 = 95% probability power threshold for immobilization Dolan and Miranda (2003)
Voltage Gradient vs Fish Length Est. Volt Grad = voltage gradient required for immobilization Dolan and Miranda (2003)
Voltage Gradient vs Fish Length Est. Volt Grad = voltage gradient required for immobilization Dolan and Miranda (2003)
Biological Factors Note: in many cases, lowest efficiencies have been observed for extreme sizes (very small and large individuals); although less power may be required for larger fish and they are easier to see, larger fish may have a greater ability to escape the electric field (“fright bias”)
Biological Factors Habitat Use (behavior, anatomy) Sculpins are benthic with absent swim bladders and often reside under rocks in shallow water More power required to immobilize and need careful technique to recover specimens
Biological Factors Habitat Use Lower efficiencies possible with deep water benthic fishes, especially those species with reduced or absent swim bladders Lower efficiencies possible for wide-ranging pelagic species (gizzard shad, striped bass)
Habitat Use Biological Factors
Behavior Biological Factors Spawning aggregations: often high catchability because fish individauls are larger, maybe more territorial, and often in shallower water Beware of the possibility of injury and reproductive impairment issues
Biological Factors Population size or density Gear saturation: catchability declines at high fish abundances or density Hansen et al. (2004) found that catchability of Age-0 walleyes (Sander vitreum) to electrofishing declined with increasing population density. Steeves et al. (2003) observed that capture efficiency declined with higher densities of sea lamprey (Petromyzon marinus) larvae
Biological Factors Effective Fish Conductivity Kolz suggested an effective fish conductivity of 150 µS/cm Miranda & Dolan (2004) suggested an effective fish conductivity of 115 µS/cm (eight species) Fish evaluated were primary freshwater fish. Species with other life histories, as secondary freshwater fish, may have different effective body conductivities.
Effective Fish Conductivity for an Ictalurid* Catfish Immobilization thresholds Limited size range *considered an “outlier” family as regards EF in the U.S.
Required Voltage Gradients across Water Conductivities for Channel catfish Immobilization thresholds Limited size range
Biological Factors Electrofishing power requirements (Kolz & Reynolds 1989)
Environmental Factors • Water quality • Ionic concentration • Temperature • Conductivity (ionic concentration & temperature) • Turbidity • Depth • Lotic flow rate (discharge)
Environmental FactorsAmbient water conductivity results from ionic concentration and temperature VIPE: very important piece of equipment
Effects of Conductivity Change Typical Patterns Electrical output characteristics Electrofishing requirements
Environmental Factors • Water temperature: • water temperature as a standardization variable, when used, is often a value selected "not too exceed", due to concerns about higher temperature induced stress/mortality, particularly of salmonids. • less commonly, temperature standardization is a value selected "not to go below", due to low temperature mediated slow-down of fish floatation rates. Largemouth bass catchability has been observed to decline when water temperatures fall below 6 degrees C. Electric seine hauls in Illinois are conducted more slowly in “winter temperatures”. • Burkholder and Parsons (2001) recommended that yoy walleye are sampled within a restricted temperature range (10 – 20°C) in Fall due to the curvilinear relationship between CPUE and water temperature.
Environmental Factors Turbidity or clarity Turbidity to an intermediate range can increase catchability
Environmental Factors Quiz question: high or low water conductivity?
Environmental Factors • Physical Habitat Depth, how low can you go?
Environmental Factors High discharge: fishes spread out and can be more difficult to sample
Environmental Factors • Substrate • Size distribution and conductivity • Lentic water body shape • Round vs. many coves • Coarse woody debris (e.g., downed logs)
Environmental Factors Substrate size and conductivity Conductive substates can help by lowering cathode resistance (e.g., trailing cathode) Non-conductive substrates do not shield buried eggs from electric fields
Environmental Factors Water body shape Catchability of some species higher in more elongated lakes with coves
Environmental Factors Coarse Woody Debris Catchability of some species higher in structure