Download
1 / 37
380 likes | 536 Views
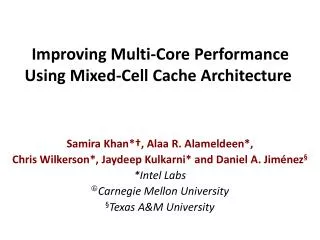
Modeling shared cache and bus in multi-core platforms for timing analysis. Sudipta Chattopadhyay Abhik Roychoudhury Tulika Mitra. Timing analysis (basics). Hard real time systems need to meet certain deadline System level or schedulability analysis

E N D
Modeling shared cache and bus in multi-core platforms for timing analysis Sudipta Chattopadhyay Abhik Roychoudhury Tulika Mitra
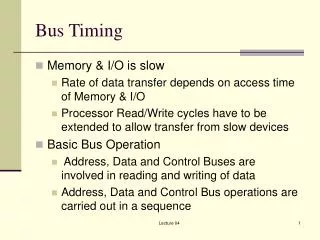
Timing analysis (basics) • Hard real time systems need to meet certain deadline • System level or schedulability analysis • Single task analysis (Worst Case Execution Time analysis) • WCET : An upper bound on the execution time for all possible inputs • Usually obtained by static analysis • Worst Case Execution Time (WCET) of a program for a given hardware platform • Usage of WCET • Schedulability analysis of hard real time systems • Worst case oriented optimization
WCET and BCET Over-estimation Observed BCET Observed WCET Actual WCET Actual BCET Actual WCET Estimated WCET Actual Estimated BCET Observed Execution Time WCET = Worst-case Execution Time BCET = Best-case Execution Time
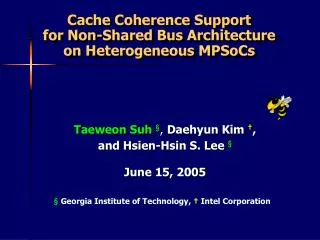
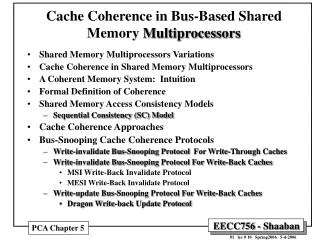
Timing analysis for multi-cores • Modeling shared cache and shared bus • Most common form of resource sharing in multi-cores • Difficulties • Conflicts in shared cache arising from other cores • Contention in shared bus introduced by other cores • Interaction between shared cache and shared bus
Commercial multi-core Processor 0 Processor 1 Core 0 Core N Core 0 Core N Shared off-chip Bus …. …. Off-chip Memory Shared L2 Shared L2 L1 L1 L1 L1 Intel Core-2 Duo Presence of both shared cache and shared bus Crossbar Crossbar
Shared Bus Shared L3 Modeled architecture • Shared cache is accessed through a shared bus Core 0 Core N Core 0 Core N Shared Bus …. …. Shared L2 L1 L1 L1 L1 L2 L2 Architecture A Architecture B
Assumptions • Perfect data cache, currently we model only shared instruction cache • Shared bus is TDMA (Time Division Multiple Access) and TDMA slots are assigned in a round-robin fashion • TDMA is chosen for predictability • Separated instruction and data bus • Bus traffic arising from data memory accesses are ignored • No self modifying code • Cache coherence need not be modeled • Non-preemptive scheduling
Overview of the framework L1 cache analysis L1 cache analysis Iterative fix-point analysis Termination of our analysis is guaranteed Cache access classification Cache access classification L2 cache analysis L2 cache analysis WCRT computation Bus aware analysis L2 conflict analysis Initial interference Yes Interference changes ? Estimated WCRT No
Framework components L1 cache analysis L1 cache analysis Cache access classification Cache access classification L2 cache analysis L2 cache analysis WCRT computation Bus aware analysis L2 conflict analysis Initial interference Yes Interference changes ? Estimated WCRT No
L1 cache analysis (Ferdinand et. al. RTS’97) Abstract cache set low {a} {a} {a} {b,c} {b,c} {b,c} age {a} {a} {a} {c} {c} {c} {b} high {a} {b,c} {a} {a} {c} {c} {b} Must Join Intersection, maximum age Finds All hit (AH) cache blocks May Join Union, minimum age Finds All Miss (AM) cache blocks Evicted blocks Persistence Join Union, maximum age Finds Persistence (PS) or never evicted cache blocks
Framework components L1 cache analysis L1 cache analysis Cache access classification Cache access classification L2 cache analysis L2 cache analysis1 WCRT computation Bus aware analysis L2 conflict analysis Initial interference Yes Interference changes ? Estimated WCRT
Per core L2 cache analysis (Puaut et. al. RTSS 2008) ACSin Memory reference Persistence or NC L1 cache All hit All miss Never accessed (N) Always accessed (A) Unknown (U) L2 cache ACSout = U(ACSin) ACSout = ACSin ∏ ACSout = ACSin ACSout = U(ACSin) Join
Framework components L1 cache analysis L1 cache analysis Cache access classification Cache access classification L2 cache analysis L2 cache analysis WCRT computation Bus aware analysis L2 conflict analysis Initial interference Yes Interference changes ? Estimated WCRT No
Shared cache conflict analysis • Our past work (RTSS 2009) • Exploit task lifetime to refine shared cache analysis • Task interference graph • There exists an edge between two task nodes if they have overlapping lifetimes • Analyze each cache set C individually
Task interference graph T2 T1 T2 Timeline T3 T1 T3 Task interference graph
Cache conflict analysis Cache set C Associativity = 4 Task interference graph m1: AH m1 T2 T1 m2 T2 m2: AH m3: AH m3 T3 T1 T3 After conflict analysis shift M(C) = 1 m1 m1: AH->AH T1 All memory blocks remain all hits M(C) = 2 T2 m2 m2: AH->AH M(C) = 1 T3 m3 m3: AH->AH
Cache conflict analysis Cache set C Associativity = 4 Task interference graph m0 m0, m1: AH m1 T2 T1 m2 T2 m2: AH m3: AH m3 T3 T1 T3 After conflict analysis M(C) = 1 m0 m1 m1: AH->AH T1 m2 may be replaced from the cache due to conflicts from other cores M(C) = 3 m2: AH->NC T2 M(C) = 1 T3 m3 m3: AH->AH
Framework components L1 cache analysis L1 cache analysis Cache access classification Cache access classification L2 cache analysis L2 cache analysis WCRT computation Bus aware analysis L2 conflict analysis Initial interference Yes Interference changes ? Estimated WCRT No
Example : variable bus delay Left Branch Common Path Right Branch t = 0 Code Executing on Core0 M1 = 10 C1 = 20 Core 0 bus slot L2 hit C1 = 20 M2 = 20 C3 = 20 t = 50 C2 = 10 C4 = 20 C3 = 20 C2 = 10 C4 = 30 C5 = 10 L2 miss Core 1 bus slot C5 = 10 t = 100 Core 0 bus slot Bus slot: 50 cycles, L2 hit: 10 cycles, L2 miss: 20 cycles, t = 150 First iteration (No bus delay)
Example : variable bus delay Left Branch Common Path Right Branch t = 0 Code Executing on Core0 M1 = 10 C1 = 20 Core 0 bus slot L2 hit C1 = 20 M2 = 20 C3 = 20 t = 50 C2 = 10 C4 = 20 C3 = 20 C2 = 10 C4 = 30 C5 = 10 L2 miss Core 1 bus slot Bus delay C5 = 10 t = 100 M1 = 10 C1 = 20 Core 0 bus slot Bus slot: 50 cycles, L2 hit: 10 cycles, L2 miss: 20 cycles, t = 150 Conclusion: WCET of different iterations could be different Second iteration (M1 suffers 20 cycles bus delay)
Possible solutions • Source of problem • Each iteration of a loop may start at different offset relative to its bus slot • Possible solutions • Virtually unroll all loop iterations – too expensive • Do not model the bus or take maximum possible bus delay – imprecise result • Our solution • Assume each loop iteration starts at the same offset relative to its bus slot and add necessary alignment cost
Key observation Timeline Bus schedule Core 0 slot Core 1 slot Core 0 slot Core 1 slot T starts at core 0 T starts at core 0 Δ Δ Round robin schedule follow repeated patterns T must follow the same Execution pattern if the offset ( Core 0 slot Core 1 slot Bus schedule Δ) is same T starts at core 0 Δ
Revisiting the example Left Branch Common Path Right Branch t = 0 Code Executing on Core0 M1 = 10 C1 = 20 Core 0 bus slot L2 hit C1 = 20 M2 = 20 C3 = 20 t = 50 C2 = 10 C4 = 20 C3 = 20 C2 = 10 C4 = 30 C5 = 10 L2 miss Core 1 bus slot Align C5 = 10 t = 100 M1 = 10 C1 = 20 Core 0 bus slot Bus slot: 50 cycles, L2 hit: 10 cycles, L2 miss: 20 cycles, t = 150 WCET of one iteration <= 100 cycles (No need to virtually unroll the loop) Alignment cost = 20 cycles (all iterations follow the same execution pattern with this alignment)
M2=10 C2=10 M2=10 Partial Unrolling t=0 C1=10 C1=10 Iter1 Iter1 M2=10 M2=10 C2=10 C2=10 Core0 Bus slot C1=10 Iter2 Alignment cost higher if the loop is very small compared to the length of bus slot Partially unroll such loops till one bus slot is filled Code Executing on Core0 C1=10 Iter3 C2=10 C1=10 t=100 L2 Hit C2=10 Iter2 C1=10 C1=10 Iter4 Core0 Bus slot No unrolling Partial unrolling
Extension to full programs WCET of outer loop WCET of inner loop
Framework components L1 cache analysis L1 cache analysis Cache access classification Cache access classification L2 cache analysis L2 cache analysis Bus aware WCET/BCET computation WCRT computation L2 conflict analysis Initial interference Yes Interference changes ? Estimated WCRT No
WCRT Task lifetime : [EarliestReady, LatestFinish] EarliestReady(t1) = 0 EarliestReady(t4) >= EarliestFinish(t2) EarliestReady(t4) >= EarliestFinish(t3) EarliestFinish = EarliestReady + BCET LatestReady(t4) >= LatestFinish (t2) LatestReady(t4) >= LatestFinish (t3) t2 has peers LatestFinish (t2) = LatestReady(t2) + WCET(t2) + WCET(t3) t4 has no peers LatestFinish (t4) = LatestReady(t4) + WCET(t4) Computed WCRT = LatestFinish(t4) (1) t1 Peers Earliest time computation t2 (2) (2) t3 t4 (1) Latest time computation Assigned core Task graph
An example Core 0 Bus Core 1 T1.1=90 T3.1=20 T1.1= 90 T3.1= 20 Core0 slot T3.2=10 Wait T3 lifetime M3.2 =20 T2.1= 10 T4.1= 20 T2.2=20 T4.2=10 T3.2 =10 Core1 slot T4.1 =20 Core 0 Core 1 T2.1= 10 T2 lifetime M2.2=20 Wait T2.2=20 L2 Hit: 10 cycles L2 Miss: 20 cycles Bus slot: 50 cycles M2.2 and M3.2 conflict in L2: Both L2 MissM4.2 is L2 Hit Core0 slot M4.2=10 T4.2 =10 Core1 slot Bus schedule based on M2.2, M3.2 L2 miss WCRT: 170 cyclesT2 and T3 have Disjoint lifetime M2.2 and M3.2 cannot conflict: Both L2 Hit
Example contd. Core 0 Bus Core 1 Core 0 Bus Core 1 T1.1=90 T3.1=20 T1.1=90 T3.1=20 Core0 slot Core0 slot Wait Wait T3 lifetime M3.2 =20 M3.2=10 T3.2 =10 T3.2=10 Core1 slot Core1 slot T4.1 =20 T4.1=20 T2.1= 10 T2 lifetime M2.2=20 M4.2=10 T2.1= 10 Wait M2.2=10 T4.2=10 T2.2=20 Core0 slot T2.2 =20 Core0 slot M4.2=10 T4.2 =10 Core1 slot Core1 slot Bus schedule based on M2.2, M3.2 L2 Hit Second bus wait for Core 1 eliminated WCRT: 130 cycles
Experimental evaluation • Tasks are compiled into Simplescalar PISA compliant binaries • CMP_SIM is used for simulation, CMP_SIM is extended with shared bus modeling and for PISA compliant binaries • Two setup • Independent tasks running in different cores • Task dependency specified through a task graph
Overestimation ratio (2-core) • One core runs statemate another core runs the program under evaluation L1 cache : direct mapped, 1 KB L2 cache : 4-way, 2 KB L1 block size = 32 bytes L2 block size = 64 bytes L1 miss latency = 6 cycles L2 miss latency = 30 cycles Bus slot length = 80 cycles Average Overestimation = 40%
Overestimation ratio (4-core) • Either runs (edn, adpcm, compress, statemate) or runs (matmult, fir, jfdcint, statemate) in 4 different cores L1 cache : direct mapped, 1 KB L2 cache : 4-way, 2 KB L1 block size = 32 bytes L2 block size = 64 bytes L1 miss latency = 6 cycles L2 miss latency = 30 cycles Bus slot length = 80 cycles Average Overestimation = 40%
Sensitivity with bus slot length (2-core) Average overestimation ratio for program Statemate
Sensitivity with bus slot length (4-core) Average overestimation ratio for program Statemate
main-tc (1) main-hm (1) main-tm (1) main-hit (1) main-aq (1) main-su (1) tc-test (3) hm-test (4) tm-test (1) hit-test (2) aq-test (4) su-test (2) WCRT analysis of task graph • Debie is an online space debris monitoring program manufactured by Space Systems Finland Ltd. • Extracted task graph (Debie-test) Assigned core number
Experimental evaluation of Debie-test L1 cache : 2-way, 2 KB L2 cache : 4-way, 8 KB L1 block size = 32 bytes L2 block size = 64 bytes L1 miss latency = 6 cycles L2 miss latency = 30 cycles Bus slot length = 80 cycles Overestimation ratio ~20% This difference clearly shows that for real life application bus modeling is essential
Extension to different multi-core architecture (e.g. Intel Core2 Duo) Processor 0 Processor 1 Shared off-chip Bus Core 0 Core N Core 0 Core N Shared L2 Shared L2 Off-chip Memory …. …. Only L2 cache misses appear in shared bus Overall framework still remains the same, only shared bus waiting time is computed for L2 cache misses L1 L1 L1 L1 Crossbar Crossbar