Download
1 / 16
260 likes | 1.74k Views
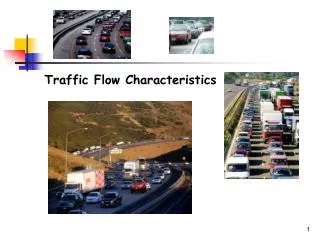
Traffic Flow Characteristics (2) . Traffic Flow Characteristics (2) . Traffic Flow Characteristics (2) . Learning Objectives. To differentiate between interrupted and uninterrupted flow facilities To define general and linear speed-density relationships

E N D
Traffic Flow Characteristics (2) Traffic Flow Characteristics (2) Traffic Flow Characteristics (2)
Learning Objectives • To differentiate between interrupted and uninterrupted flow facilities • To define general and linear speed-density relationships • To derive, sketch, and apply Greenshield’s Model of traffic flow
Recap Spacing
Recap Clearance
Recap # vehicles/Distance Density
Recap… • Speed (v) – ft/sec or mph • Flow (q) – veh/sec or vph • Density (k) – veh/ft or vpm • Spacing (s) – ft/veh • Headway (h) – sec/veh • Clearance (c) – ft/veh • Gap (g) – sec/veh Remember, units are critical!
Fundamental Relationships • q = k v (veh/hr) = (veh/mi) (mi/hr) • h = 1 /q (sec/veh) = 1 / (veh/hr) (3600) • s = 1 /k (ft/veh) = 1 / (veh/mi) (5280)
Types of Facilities • Uninterrupted flow • Freeways • Multilane highways • Two-lane highways
Types of Facilities • Interrupted flow • Signalized streets • Un-signalized streets with stop signs • Transit lanes • Pedestrian walkways
General Speed-Density Relationship p.130 S V Free normal flow forced flow Traffic Jam Q Capacity K Density at Capacity Jam Density
General Speed-Density Relationship p.137 K V Traffic Jam Free forced flow normal flow Q Capacity K Density at Capacity Jam Density
General Speed-Density Relationship p.137 Q V Capacity Free Traffic Jam V K Density at Capacity Jam Density
Greenshield’s Model • Assume a linear relationship between v and k: Low Density = High Speed vf High Density = Low Speed kj
vf v0 Greenshield’s Model Q Max flow qmax K Kj K0
Greenshield’s Model V Vf 1/k0=s0 V0 Q Qmax Max flow
Example Assuming a linear v-k relationship, the mean free speed is 60 mph near zero density, and the corresponding jam density is 140 vpm. Assume the average length of vehicles is 20 ft. Find: • v(k) and q(k) • Sketch v-k, v-q, and q-k diagrams • Compute v and k at q=1000 vph • Compute the average headway, spacings, clearances, and gaps when the flow is maximum