Download

1 / 35
360 likes | 372 Views
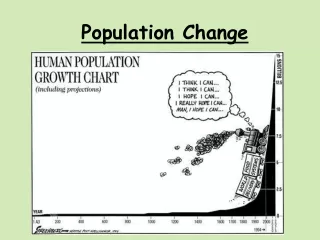
Global Population Change. What we will cover before Christmas. Population Indicators – birth rate, death rate, infant mortality rate, fertility rate and life expectancy Population change – the Demographic Transition Model UK – demographic change, population structure and ageing populations.

E N D
What we will cover before Christmas Population Indicators – birth rate, death rate, infant mortality rate, fertility rate and life expectancy Population change – the Demographic Transition Model UK – demographic change, population structure and ageing populations
Population Change Births and immigration Deaths and emigration zero population growth (ZPG) occurs when the number of people in a given area neither grows nor declines
Birth rate – the number of live births per 1000 per year Death rate – the number of deaths per 1000 per year
Birth and Death Rates Nb Europe’s birth rate is less than the death rate
Changes in population - fertility Fertility rate – the average number of children born to each woman in a population during her lifetime. It is a measure of the ability of a population to replace itself. Rate needs to be 2.1 to replace itself (some babies die during infancy) It can also be defined as the number of live births per 1000 women (aged 15-49) in one year
What factors affect fertility? • Governmental policies (whether the government is pro-natalist or anti-natalist) • Religious Beliefs • Poverty/Economic prosperity • Tradition/Social beliefs • Average age for marriage • Existing age structures • Urbanisation • Literacy (with special emphasis on female literacy) • Infant mortality rate • Conflict (war, security, safety)
Changes in population - mortality Mortality rate – crude death rate is the most common measure of mortality although infant mortality and life expectancy are two other common measure used Life expectancy – this is the numbers of years that a person is expected to live Infant mortality – this is the number of deaths of children under the age of one year, expressed per thousand per year
What factors affect mortality? • Infant mortality – areas with high rates of infant mortality have high rates of overall mortality • Infant mortality is falling across the world but there are still wide variations. Why? • Malnutrition and under-nutrition • Limited access to clean drinking water • Poor sanitation and hygiene • Limited access to medical provision e.g. vaccination programmes
What factors affect mortality? • Medicine • Economic development • Disease • AIDS • Accidents • War • Lifestyle choices
1) 12.6% Ischaemic heart disease 2) 9.7% Cerebrovascular disease 3) 6.8% Lower respiratory infections 4) 4.9% HIV/AIDS 5) 4.8% Chronic obstructive pulmonary disease 6) 3.2% Diarrhoeal diseases 7) 2.7% Tuberculosis 8) 2.2% Malaria 9) 2.2% Trachea/bronchus/lung cancers 10) 2.1% Road traffic accidents Mortality Rate This list shows the 10 leading causes of death in 2009 (WHO)
Leading causes of death in developed and developing countries
Question - June 2008 • Arrange the countries in order of development (4) • (ii) Suggest reasons for your chosen order (7)
Stage 1 – High stationary stage Death rates and birth rates are high (often between 30 to 40 per 1000) although they fluctuate due to wars, famine, drought and disease. Population remains fairly stable and natural increase is low. There are no countries in Stage 1 although some remote tribes in the tropical rainforest may have these characteristics
Stage 2 – Early expanding phase Birth rates remain high but death rates start to fall resulting in high rates of natural increase and population growth. This is due to due to improvements in food supply, sanitation, education and better medical provision.
Stage 3 – Late Expanding Phase The pace of population increase begins to slow down as the death rate continues to fall and the birth rate also begins to decrease. This is due to: • Lower infant mortality • Urbanisation • Family planning • Education (especially women) • Materialism • Increase in status of women The rate of natural increase is low
Stage 4 – Low stationary phase Low birth rates and death rates giving low natural increase. There are small fluctuations and occasional ‘baby booms’ often linked to economic prosperity.
Stage 5 – Zero population growth and population decline This fifth stage has only been recognised in recent years and only in a few countries (Italy, Sweden and Japan). This is due to: • Greater independence of woman (especially financially) • Less social pressure for the ‘traditional family’ with children • Death rates may remain consistently low or increase slightly due to increases in lifestyle diseases due to low exercise levels and high obesity and an ageing population in developed countries. This creates an economic pressure on the smaller working population
UK – demographic change, population structure and ageing populations
Population Pyramids Dependency ratio = (population 0-19) + (population >60) population 20-59
Population change in the UK 1700’s High and fluctuating birth & death 1800’s Industrial revolution Demand for labourers (economic advantage to have large family) Later improved water supply and sewerage Birth control advice Compulsory education Public Health Acts 1848 and 1869 1900’s Medical developments Two world wars Greater focus on child welfare Widespread contraceptive use after 1960 Legalised abortion 1967 Standards of living increased and growth of the consumer society More women in education and careers 2000’s Low birth rates and death rates and a concern about low population growth. Ageing population
UK population pyramid 2011 UK population pyramid 2025
Demographic ageing • Falling mortality rates • Increase in life expectancy (longevity) • Decline in fertility
Demographic ageing • UK Facts • In 2007 the number of people above State Pension Age (SPA) exceeded those aged under 16 for the first time ever, and older people now make up the fastest-growing group in the population. • In 2007 9.8 million people were aged over 65 but by 2032 this figure is projected to rise to 16.1 million – equivalent to almost one in four of the population. • At the same time, the numbers of the ‘oldest old’ – people aged 85 and over – will more than double, rising from 1.3 million in 2007 to 3.1 million in 2032. • 2014, projections suggest, over-65-year-olds will overtake the under-16s. • 2025, the number of over-60s will have passed the under-25s for the first time. • Life expectancy at birth is increasing but an even more telling figure is the increase in life expectancy after 60. In the UK, a man who turned 60 in 1981 could expect to live another 16 years and a woman almost 21 years. By 2003 this had increased to 20 years for men and 23 for women; and according to official UK projections, by 2026 this will rise to almost 24 years for men and almost 27 for women.
Options • - Pensioners are poorer • - Taxes and National Insurance increase • Age of retirement increases. This will be equalised for men and women at 65 in the UK between 2010 and 2020 but it could rise even further. Already 67 in Denmark, Norway and 70 in Iceland • - Make it compulsory to contribute to a private pension fund, people must save for their own retirement • Reduce the way in which pension funds are distributed to protect less well off at the expense of the more well off (will meet opposition)
The UK’s ageing future – other considerations • the 'compression of morbidity‘ • retired people continue to pay their taxes • many retired people care, unpaid, for their grandchildren or their own elderly relatives – estimates suggest this is worth £10 billion a year • figures suggest that up to 35% of people aged 75+ regularly give up some of their free time to help others • the ‘grey pound’ • participation in society in other ways, such as voting or joining pressure groups and forums, is also high among current retirees • voting power
Sample questions January 2010 Distinguish between birth rate and fertility rate (4) Outline the usefulness of infant mortality as an indicator of development (4) June 2009 Outline and comment on the economic and political consequences of population change (15) Specimen paper Define infant mortality and life expectancy (4) Outline some of the issues for economic development linked with a population structure with a very high proportion of people over 65 years old (5) Additional specimen questions In order to calculate the Population Growth Rate for a country you would need the figure for Birth Rate (%). What is the other vital rates (population statistic) you would need and explain how you would use them to calculate the Growth Rate? (4) Some of the countries in Figure 7 could be said to be in Stage 5 of the demographic transition model. Discuss the implications of a shrinking population for the economies of countries affected. (5)