Download
1 / 30
300 likes | 609 Views
Use of the False Discovery Rate for Evaluating Clinical Safety Data. Joseph F. Heyse Devan V. Mehrotra Clinical Biostatistics – Vaccines Merck Research Laboratories Blue Bell, PA Third International Conference on Multiple Comparisons Bethesda, MD August 6, 2002. Acknowledgment.

E N D
Use of the False Discovery Rate for Evaluating Clinical Safety Data Joseph F. Heyse Devan V. Mehrotra Clinical Biostatistics – Vaccines Merck Research Laboratories Blue Bell, PA Third International Conference on Multiple Comparisons Bethesda, MD August 6, 2002
Acknowledgment • This research was in collaboration with the late Professor John Tukey (Princeton University).
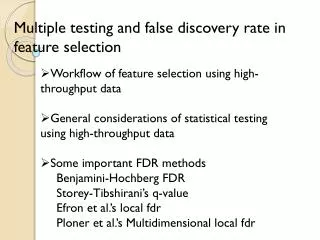
Outline • Motivating example • Multiplicity issues • FWER and FDR • Proposal for flagging AEs • Summary of three examples • Concluding remarks
Introduction • Evaluation of safety is an important part of clinical trials of pharmaceutical and biological products. • Adverse experiences (AEs) can be categorized as three types • Tier 1: Associated with specific hypotheses • Tier 2: Set encountered as part of trial safety evaluation • Tier 3: Rare spontaneous reports of serious events that require clinical evaluation • Our interest is primarily Tier 2
ICH Recommendations • ICH-E9 recommends descriptive statistical methods supplemented by confidence intervals • p-values useful to evaluate a specific difference of interest • If hypothesis tests are used, statistical adjustments for multiplicity to quantitate the Type I error are appropriate, but the Type II error is usually of more concern • p-values sometimes useful as a “flagging” device applied to a large number of safety variables to highlight differences worthy of further attention
IllustrationMultiplicity in Safety Assessment • Clinical trial compared the safety and immunogenicity of the combination vaccine COMVAX™* to its monovalent components • 1 of 92 safety comparisons revealed a higher rate of unusual high-pitched crying (UHPC) following the second of a three-dose series (6.7% vs. 2.3%, p=0.016) • No medical rationale for this finding was discovered and a larger hypothesis-driven study was designed • Comparable rates were observed following vaccination in this larger trial *COMVAX™ is a combination of HIB and HB vaccine
Motivating Example(MMRV* Vaccine) • Safety and immunogenicity vaccine trial. • Study population: healthy toddlers, 12-18 months of age • Group 1 = MMRV + PedvaxHIB on Day 0 • Group 2 = MMR + PedvaxHIB on Day 0, followed by (optional) varicella vaccine on Day 42 *MMRV is a combination measles, mumps, rubella, varicella vaccine
Motivating Example (cont’d) • Safety follow-up (local and systemic reactions) Group 1: Day 0-42 (N=148) Group 2: Day 0-42 (N=148) and Day 42-84 (N=132) • Question: Is the safety profile different if the varicella component is given as part of a combination vaccine on Day 0 compared with giving it 6 weeks later as a monovalent vaccine? • AEs: Group 1 (Day 0-42) vs. Group 2 (Day 42-84)
Grp 1 (N1=148) X1 57 34 2 3 27 7 2 2 24 3 2 19 3 Grp 2 (N2=132) X2 40 26 0 1 20 2 0 0 10 1 7 19 2 # BS ADVERSE EXPERIENCE 1 01 ASTHENIA / FATIGUE 2 01 FEVER 3 01 INFECTION, FUNGAL 4 01 INFECTION, VIRAL 5 01 MALAISE 6 03 ANOREXIA 7 03 CANDIDIASIS, ORAL 8 03 CONSTIPATION 903 DIARRHEA 10 03 GASTROENTERITIS, INFECTIOUS 11 03 NAUSEA 12 03 VOMITING 13 05 LYMPHADENOPATHY DIFF (%) 8.2 3.3 1.4 1.3 3.1 3.2 1.4 1.4 8.6 1.3 -4.0 -1.6 0.5 p-value .1673 .5606 .4998 .6248 .5248 .1791 .4998 .4998 .0289* .6248 .0889 .7295 1.0000 Clinical AE Counts (“Tier 2” AEs)
Grp 1 (N1=148) X1 0 2 2 75 4 4 1 13 28 2 13 15 3 Grp 2 (N2=132) X2 2 0 2 43 1 2 2 8 20 1 8 14 1 # BS ADVERSE EXPERIENCE 14 06 DEHYDRATION 15 08 CRYING 16 08 INSOMNIA 17 08 IRRITABILITY 18 09 BRONCHITIS 19 09 CONGESTION, NASAL 20 09 CONGESTION, RESPIRATORY 21 09 COUGH 22 09 INFECTION, RESPIRATORY, UPPER 23 09 LARYNGOTRACHEOBRONCHITIS 24 09 PHARYNGITIS 25 09 RHINORRHEA 26 09 SINUSITIS DIFF (%) -1.5 1.4 -0.2 18.1 1.9 1.2 -0.8 2.7 3.8 0.6 2.7 -0.5 1.3 p-value .2214 .4998 1.0000 .0025* .3746 .6872 .6033 .4969 .4308 1.0000 .4969 1.0000 .6248 Clinical AE Counts (“Tier 2” AEs) - cont’d
Grp 1 (N1=148) X1 2 3 4 2 2 13 6 8 4 0 1 0 18 2 Grp 2 (N2=132) X2 1 1 0 0 1 3 2 1 2 2 2 2 14 1 # BS ADVERSE EXPERIENCE 27 09 TONSILLITIS 28 09 WHEEZING 29 10 BITE/STING, NON-VENOMOUS 30 10 ECZEMA 31 10 PRURITUS 32 10 RASH 33 10 RASH, DIAPER 34 10 RASH, MEASLES/RUBELLA-LIKE 35 10 RASH, VARICELLA-LIKE 36 10 URTICARIA 37 10 VIRAL EXANTHEMA 38 11 CONJUNCTIVITIS 39 11 OTITIS MEDIA 40 11 OTORRHEA DIFF (%) 0.6 1.3 2.7 1.4 0.6 6.5 2.5 4.6 1.2 -1.5 -0.8 -1.5 1.6 0.6 p-value 1.0000 .6248 .1248 .4998 1.0000 .0209* .2885 .0388* .6872 .2214 .6033 .2214 .7109 1.0000 Clinical AE Counts (“Tier 2” AEs) - cont’d
Multiplicity Issues - The Problem • Potential for too many false positive safety findings if the multiplicity problem is ignored (for “Tier 2” AEs). • This can muddy the interpretation of the safety profile of the vaccine/drug.
Multiplicity Issues - The Challenge To develop a procedure for tackling multiplicity that: • Provides a proper balance between “no adjustment” and “too much adjustment”. • Is easy to automate/implement.
Familywise Error Rate (FWER) • Let F = {H1,H2 … Hm} denote a family of m hypotheses. • FWER = Pr(any true Hi F is rejected). • We usually seek methods for which FWER a. • Benjamini & Hochberg (1995) argue that, in certain settings, requiring control of the FWER is often too conservative. They suggest controlling the “false discovery rate” instead, as a more powerful alternative. Benjamini , Y. and Hochberg, Y. (1995). Controlling the false discovery rate: A practical and powerful approach to multiple testing. Journal of the Royal Statistical Society, B, 57, 289-300.
False Discovery Rate (FDR) (cont’d)(Benjamini & Hochberg) {This controls FDR at } m • FDR FWER {equality holds if m = m0}. • Effect of correlations on FDR is an area of research. Example
Proposal for Flagging AEs • We routinely summarize AEs by body system (BS). s body systems (i = 1, 2, …, s) ki AEs associated with body system i pij= between-group p-value for the jth AE within ith BS (e.g., based on two-tailed Fisher’s exact test.)
Proposal for Flagging AEs (cont’d) • Step 1 Ignore AEs for which the total incidence is so low that a rejection even at the unadjusted 0.05 level is impossible. • Step 2 Among the remaining AEs, flag those for which the p-value achieves statistical significance after adjusting for multiplicity using a “Double FDR” approach.
Double FDR Approach • Define This represents the strongest safety “signal” for body system i. • 1st level FDR adjustment • Apply FDR adjustment to • Let • 2nd level FDR adjustment • Within body system i, apply FDR adjustment to • Let
Double FDR Approach (cont’d) Proposed Flagging Rule Flag AE(i,j) if • What values of a1 and a2 should we use?
Choosing a1 and a2 • Set a2 = a and use either (a) or (b) below for a1. (a) Using resampling (non-parametric bootstrap) to determine the largest data-dependent a1 ( a2) that ensures FDR a. OR (b) Choose a1 ( a2) independent of the data. For example, let , and estimate the resulting FDR using resampling.
No multiplicity adjustment; flag AE if unadjusted p < .05 Full FDR adjustment (ignore BS grouping) Double FDR adjustment for selected (a1, a2) NOADJ FULLFDR(a) DFDR(a1, a2) Resampling Procedure • Purpose • To estimate the false discovery rates of the following: • To determine the largest a1( a2) that guarantees FDR a when using DFDR(a1, a2).
Resampling Procedure (cont’d) • Details 1. POOL data from both treatment groups into a common population. Sample with replacement from this common population, to simulate many repetitions of the original trial. This procedure: a) simulates a true null situation (Group 1 = Group 2). b) preserves the correlation structure of original data. 2. Implement our proposal for flagging AEs using the NOADJ, FULLFDR(a), and DFDR(a1, a2) approaches, and calculate the corresponding FDRs.
MMRV Example - Resampling Results * out of 40; 2000 simulations
MMRV Example - Resampling Results DFDR(a1, a2): Estimated FDR (%)
Number of AE Types 3 9 7 5 3 1 11 1 FDR Adjusted p-value 0.0200 0.0771 0.0771 0.2952 0.2952 0.2952 0.4281 1.0000 Unadjusted p-value 0.0025 0.0209 0.0289 0.1673 0.2214 0.2214 0.3746 1.0000 Body System ID Nervous system Skin Digestive system Body site unspecified Special senses Metabolic / immune Respiratory Hematologic and lymphatic First Level FDR Adjustment
Unadjusted p-value 0.0025 0.4998 1.0000 FDR Adjusted p-value 0.0075 0.7497 1.0000 Adverse Experience Irritability Crying Insomnia Second Level FDR Adjustment Body System 08: Nervous System and Psychiatric
Concluding Remarks • Current approach of flagging AEs based on unadjusted p-values (or C.I.s) can result in excessivefalse positive safety findings. These can cause undue concern for approval/labeling, and can affect post-marketing commitments. • Under our proposal, the unadjusted p-values (or C.I.s) would still be reported. The Double FDR multiplicity adjustment is a method to facilitate the interpretation of the unadjusted p-values.
Concluding Remarks (cont’d) • Our proposal for tackling multiplicity will: • substantially reduce the percentage of incorrectly flagged AEs. • be better accepted if described a priori in the protocol/DAP rather than on a post-hoc basis. • facilitate comparable interpretation of safety results across studies, with respect to Type I error.